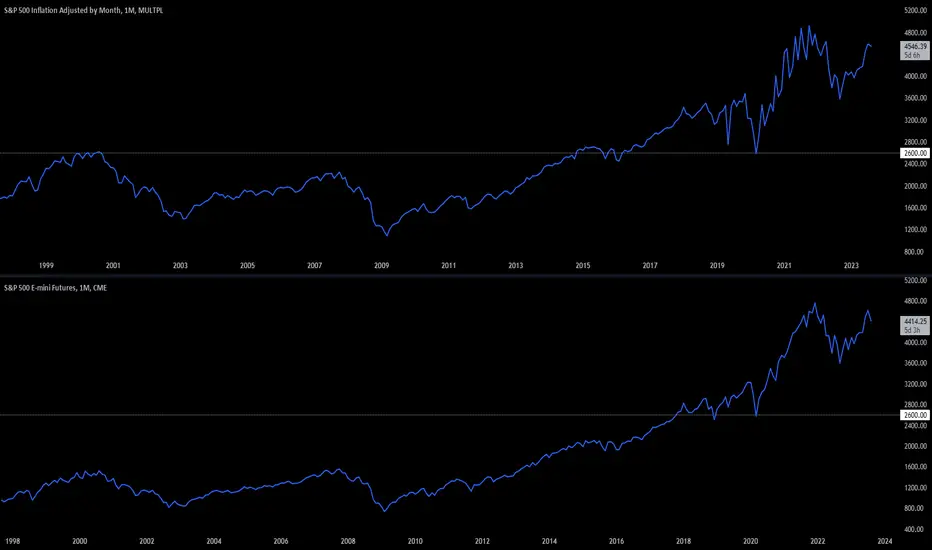
This is a comparison chart between S&P 500 inflation adjusted and S&P 500.
From 2021 through 2023 to date the S&P 500 has been volatile yet resulting in neutral returns now. From 2016 to 2021 the S&P 500 was in a highly volatile bull market. From 2009 to 2016 the S&P 500 was in a steady bull market. From 2007 to 2009 the S&P 500 was in a steep bear market. From 2003 to 2007 the S&P 500 was in a steady bull market. From 2000 to 2003 the S&P 500 was in a bear market. From 1995 to 2000 the S&P 500 was in a steep bull market.
As you can see on the S&P 500 inflation adjusted chart, the 2020 covid low was the same price as the 2000 high.
USD vs USD / Cumulative rate of inflation:
2022-2023 = $1.03 / 3%
2021-2023 = $1.13 / 12.6%
2020-2023 = $1.18 / 17.9%
2019-2023 = $1.19 / 19.3%
2018-2023 = $1.22 / 21.5%
2017-2023 = $1.24 / 24.5%
2016-2023 = $1.27 / 27.1%
2015-2023 = $1.29 / 28.7%
2014-2023 = $1.29 / 28.9%
2013-2023 = $1.31 / 31%
2012-2023 = $1.33 / 32.9%
2011-2023 = $1.36 / 35.6%
2010-2023 = $1.40 / 39.9%
2009-2023 = $1.42 / 42.2%
2008-2023 = $1.42 / 41.7%
2007-2023 = $1.47 / 47.2%
2006-2023 = $1.51 / 51.3%
2005-2023 = $1.56 / 56.2%
2004-2023 = $1.62 / 61.5%
2003-2023 = $1.66 / 65.8%
2002-2023 = $1.70 / 69.6%
2001-2023 = $1.72 / 72.4%
2000-2023 = $1.77 / 77.2%
Trading indicators:
tradingview.com/u/Options360/
tradingview.com/u/Options360/
Disclaimer
The information and publications are not meant to be, and do not constitute, financial, investment, trading, or other types of advice or recommendations supplied or endorsed by TradingView. Read more in the Terms of Use.