A quickly escalating conflict in the Middle East between Israel and Iran has seen Oil (WTI) volatility increase dramatically as the focus for traders has shifted overnight from worries about an on-going lack of demand due to a slowing global economy over to major supply concerns moving forward from this oil rich region.
This shift has seen Oil trade from lows of 60.17 on May 30th, to an early Monday high of 76.31, as weekend attacks by Israel on Iran's energy infrastructure introduced more uncertainty at the start of this new trading week regarding Israel's future strategy in this conflict. Prices have since settled down and moved back towards 72.80 (0830 BST) at time of writing but looking forward traders may need to balance the potential for further escalation/duration of this conflict against extra Oil production/supply from OPEC+ and the US.
Also important for Oil prices across the week could be the outcome of the Federal Reserve (Fed) Interest Rate Decision (Wed 1900 BST) and Press Conference (Wed 1930 BST). No change to interest rates is expected, but the updates from Fed policymakers to their inflation and interest rate expectations for the rest of 2025 could have a major impact on risk sentiment, the dollar and anticipated Oil demand.
Technical Update: Utilising Bollinger Bands
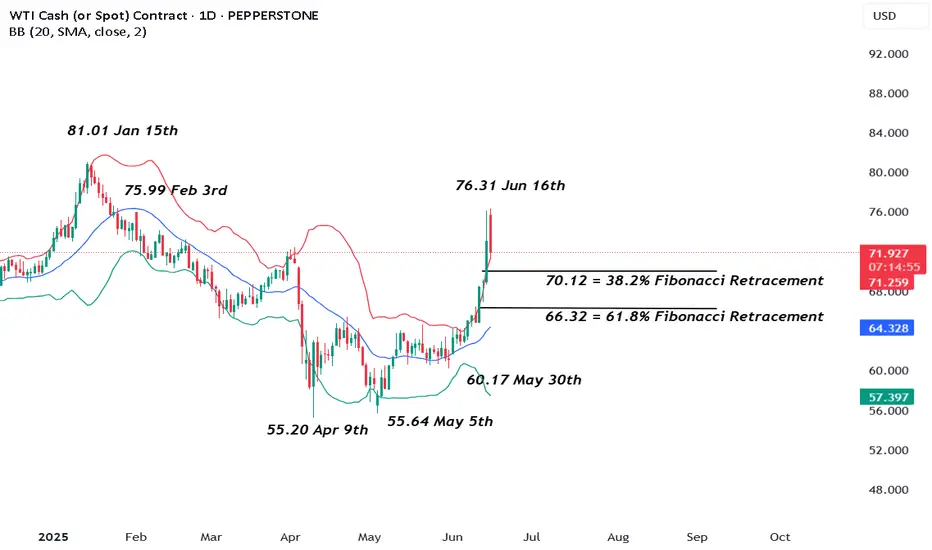
A rise in tensions in the Middle East last week prompted a sharp acceleration higher in the price of Oil. This saw price volatility increase, reflected by the widening upper and lower Bollinger bands and prices trading to levels last seen in late January 2025, as the chart below shows.

Traders will now likely be wondering if this type of price strength can continue, or if prices can enter a correction phase, even possibly a more extended period of price weakness.
Much will clearly depend on future market sentiment and price trends, and on any easing or escalation in geo-political tensions. However, with this in mind let's consider what may be the relevant support and resistance levels .
Potential Resistance Levels:
As the chart shows below, interestingly, last weeks price strength stalled against 75.99, which is equal to the February 3rd session high and with a setback in price developing from it so far today, this might be viewed by some as a potential first resistance.
As such, while not a guarantee of further price strength, closing breaks above 75.99 may be a sign of continued upside momentum towards 81.01, which is the January 15th price high and a potential next resistance focus for traders.
Potential Support Levels:
After such a strong advance in price, it might be harder to establish support levels, although, Fibonacci retracement levels on the recent May 30th to June 16th upside move in price, might prove useful. These retracement levels are highlighted on the chart below.
The 38.2% Fibonacci retracement of the price strength stands at 70.12 and this might prove to be a possible first support focus, if price weakness is seen over coming days. Closing breaks below 70.12, if seen, may then lead to declines towards 66.32, the deeper 61.8% Fibonacci retracement level.
The material provided here has not been prepared
accordance with legal requirements designed to promote the independence of investment research and as such is considered to be a marketing communication. Whilst it is not subject to any prohibition on dealing ahead of the dissemination of investment research, we will not seek to take any advantage before providing it to our clients.
Pepperstone doesn’t represent that the material provided here is accurate, current or complete, and therefore shouldn’t be relied upon as such. The information, whether from a third party or not, isn’t to be considered as a recommendation; or an offer to buy or sell; or the solicitation of an offer to buy or sell any security, financial product or instrument; or to participate in any particular trading strategy. It does not take into account readers’ financial situation or investment objectives. We advise any readers of this content to seek their own advice. Without the approval of Pepperstone, reproduction or redistribution of this information isn’t permitted.
This shift has seen Oil trade from lows of 60.17 on May 30th, to an early Monday high of 76.31, as weekend attacks by Israel on Iran's energy infrastructure introduced more uncertainty at the start of this new trading week regarding Israel's future strategy in this conflict. Prices have since settled down and moved back towards 72.80 (0830 BST) at time of writing but looking forward traders may need to balance the potential for further escalation/duration of this conflict against extra Oil production/supply from OPEC+ and the US.
Also important for Oil prices across the week could be the outcome of the Federal Reserve (Fed) Interest Rate Decision (Wed 1900 BST) and Press Conference (Wed 1930 BST). No change to interest rates is expected, but the updates from Fed policymakers to their inflation and interest rate expectations for the rest of 2025 could have a major impact on risk sentiment, the dollar and anticipated Oil demand.
Technical Update: Utilising Bollinger Bands
A rise in tensions in the Middle East last week prompted a sharp acceleration higher in the price of Oil. This saw price volatility increase, reflected by the widening upper and lower Bollinger bands and prices trading to levels last seen in late January 2025, as the chart below shows.
Traders will now likely be wondering if this type of price strength can continue, or if prices can enter a correction phase, even possibly a more extended period of price weakness.
Much will clearly depend on future market sentiment and price trends, and on any easing or escalation in geo-political tensions. However, with this in mind let's consider what may be the relevant support and resistance levels .
Potential Resistance Levels:
As the chart shows below, interestingly, last weeks price strength stalled against 75.99, which is equal to the February 3rd session high and with a setback in price developing from it so far today, this might be viewed by some as a potential first resistance.
As such, while not a guarantee of further price strength, closing breaks above 75.99 may be a sign of continued upside momentum towards 81.01, which is the January 15th price high and a potential next resistance focus for traders.
Potential Support Levels:
After such a strong advance in price, it might be harder to establish support levels, although, Fibonacci retracement levels on the recent May 30th to June 16th upside move in price, might prove useful. These retracement levels are highlighted on the chart below.
The 38.2% Fibonacci retracement of the price strength stands at 70.12 and this might prove to be a possible first support focus, if price weakness is seen over coming days. Closing breaks below 70.12, if seen, may then lead to declines towards 66.32, the deeper 61.8% Fibonacci retracement level.
The material provided here has not been prepared
accordance with legal requirements designed to promote the independence of investment research and as such is considered to be a marketing communication. Whilst it is not subject to any prohibition on dealing ahead of the dissemination of investment research, we will not seek to take any advantage before providing it to our clients.
Pepperstone doesn’t represent that the material provided here is accurate, current or complete, and therefore shouldn’t be relied upon as such. The information, whether from a third party or not, isn’t to be considered as a recommendation; or an offer to buy or sell; or the solicitation of an offer to buy or sell any security, financial product or instrument; or to participate in any particular trading strategy. It does not take into account readers’ financial situation or investment objectives. We advise any readers of this content to seek their own advice. Without the approval of Pepperstone, reproduction or redistribution of this information isn’t permitted.
Global risk Warning CFDs are complex instruments and come with a high risk of losing money rapidly due to leverage. Between 74-89% of retail investor accounts lose money when trading in CFDs. You should consider whether you understand how CFD
Disclaimer
The information and publications are not meant to be, and do not constitute, financial, investment, trading, or other types of advice or recommendations supplied or endorsed by TradingView. Read more in the Terms of Use.