Oil (WTI) has moved back to the forefront of traders thinking this week after OPEC+’s weekend decision to raise September production by circa 550k barrels per day. They also put traders on notice that all options remain open regarding further production increases to replace another output layer, amounting to 1.66 million barrels per day that has been offline since 2023. A decision on what comes next is due to take place at a meeting scheduled for September 7th.
Perhaps unsurprisingly, this potential for extra production (supply) being unleashed into the market later in the year has led to some downside pressure for Oil this week. This is because it comes at a time of uncertainty surrounding Oil demand due to possible weaknesses in the global economy, created by President Trump’s tariff policies. Oil (WTI) prices have fallen 4.8% from opening levels on Monday to post a new 1 month low at 64.20 yesterday, a level that it currently holding (more on this in technical update below).
Looking forward, one of the challenges traders are facing for where Oil moves next is President Trump’s August 8th deadline for Russia to end the war with Ukraine or face fresh sanctions on its energy exports. President Trump has also suggested he would increase tariffs on countries buying Oil from Russia, including China, although right now India is his initial focal point in this regard and yesterday, he doubled tariffs on Indian goods (25% to 50%) due to the country’s purchases of Russian Oil. These new tariffs are due to start in 3 weeks’ time.
With so much uncertainty surrounding Oil prices, including reports of a possible meeting between President Trump and President Putin being scheduled at some stage next week, it could be useful to be prepared for a potential increase in Oil (WTI) price volatility.
Technical Update: New Correction Lows Posted
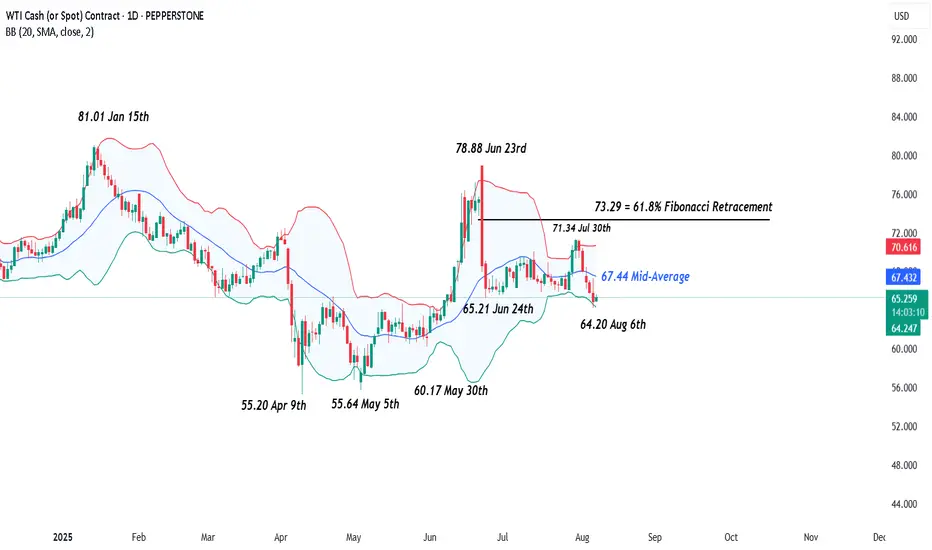
Having seen the sharp sell-off in Oil between June 23rd and 24th 2025, a period of more balanced activity developed, as a reaction to over-extended downside conditions in price.

As the chart above shows, this resulted in a phase of sideways price activity between support marked by the 65.21 June 24th low, up to 71.34, which is equal to the July 30th failure high. However, price declines on Wednesday this week, have produced closes below 65.21, in the process of posting a new correction low at 64.20.
While communications between the US and Russia regarding the war in Ukraine are on-going, this type of break lower in the Oil price is no guarantee of future declines, so it could be helpful to assess what could be the potential support and resistance levels to focus on, just in case the outcome of these events lead to an increase in Oil price volatility.
Possible Next Support Levels:
As we have said above, the August 6th price weakness has seen a new correction low posted at 64.20, and this may now be viewed as the first support focus. Closes below 64.20 might then lead to a more extended decline in price.
Such moves would indicate the potential of further price weakness, with the next support possibly marked by the May 30th session low at 60.17, perhaps further towards 55.64 (May 5th low), if this level in turn gives way.
Potential Resistance Levels:
On the topside, within a period of price weakness, it can be the declining Bollinger mid-average that reflects the first possible resistance, and for Oil this currently stands at 67.44. Closing breaks above 67.44, if seen, could prompt further attempts to develop price strength to test higher resistance levels.
The first possible level would appear to be marked by 71.34, which is the July 30th session high. If this level was broken on a closing basis, it might then lead to tests of 73.29, which is equal to the 61.8% Fibonacci retracement of the June 23rd to June 24th sell-off.
The material provided here has not been prepared accordance with legal requirements designed to promote the independence of investment research and as such is considered to be a marketing communication. Whilst it is not subject to any prohibition on dealing ahead of the dissemination of investment research, we will not seek to take any advantage before providing it to our clients.
Pepperstone doesn’t represent that the material provided here is accurate, current or complete, and therefore shouldn’t be relied upon as such. The information, whether from a third party or not, isn’t to be considered as a recommendation; or an offer to buy or sell; or the solicitation of an offer to buy or sell any security, financial product or instrument; or to participate in any particular trading strategy. It does not take into account readers’ financial situation or investment objectives. We advise any readers of this content to seek their own advice. Without the approval of Pepperstone, reproduction or redistribution of this information isn’t permitted.
Perhaps unsurprisingly, this potential for extra production (supply) being unleashed into the market later in the year has led to some downside pressure for Oil this week. This is because it comes at a time of uncertainty surrounding Oil demand due to possible weaknesses in the global economy, created by President Trump’s tariff policies. Oil (WTI) prices have fallen 4.8% from opening levels on Monday to post a new 1 month low at 64.20 yesterday, a level that it currently holding (more on this in technical update below).
Looking forward, one of the challenges traders are facing for where Oil moves next is President Trump’s August 8th deadline for Russia to end the war with Ukraine or face fresh sanctions on its energy exports. President Trump has also suggested he would increase tariffs on countries buying Oil from Russia, including China, although right now India is his initial focal point in this regard and yesterday, he doubled tariffs on Indian goods (25% to 50%) due to the country’s purchases of Russian Oil. These new tariffs are due to start in 3 weeks’ time.
With so much uncertainty surrounding Oil prices, including reports of a possible meeting between President Trump and President Putin being scheduled at some stage next week, it could be useful to be prepared for a potential increase in Oil (WTI) price volatility.
Technical Update: New Correction Lows Posted
Having seen the sharp sell-off in Oil between June 23rd and 24th 2025, a period of more balanced activity developed, as a reaction to over-extended downside conditions in price.
As the chart above shows, this resulted in a phase of sideways price activity between support marked by the 65.21 June 24th low, up to 71.34, which is equal to the July 30th failure high. However, price declines on Wednesday this week, have produced closes below 65.21, in the process of posting a new correction low at 64.20.
While communications between the US and Russia regarding the war in Ukraine are on-going, this type of break lower in the Oil price is no guarantee of future declines, so it could be helpful to assess what could be the potential support and resistance levels to focus on, just in case the outcome of these events lead to an increase in Oil price volatility.
Possible Next Support Levels:
As we have said above, the August 6th price weakness has seen a new correction low posted at 64.20, and this may now be viewed as the first support focus. Closes below 64.20 might then lead to a more extended decline in price.
Such moves would indicate the potential of further price weakness, with the next support possibly marked by the May 30th session low at 60.17, perhaps further towards 55.64 (May 5th low), if this level in turn gives way.
Potential Resistance Levels:
On the topside, within a period of price weakness, it can be the declining Bollinger mid-average that reflects the first possible resistance, and for Oil this currently stands at 67.44. Closing breaks above 67.44, if seen, could prompt further attempts to develop price strength to test higher resistance levels.
The first possible level would appear to be marked by 71.34, which is the July 30th session high. If this level was broken on a closing basis, it might then lead to tests of 73.29, which is equal to the 61.8% Fibonacci retracement of the June 23rd to June 24th sell-off.
The material provided here has not been prepared accordance with legal requirements designed to promote the independence of investment research and as such is considered to be a marketing communication. Whilst it is not subject to any prohibition on dealing ahead of the dissemination of investment research, we will not seek to take any advantage before providing it to our clients.
Pepperstone doesn’t represent that the material provided here is accurate, current or complete, and therefore shouldn’t be relied upon as such. The information, whether from a third party or not, isn’t to be considered as a recommendation; or an offer to buy or sell; or the solicitation of an offer to buy or sell any security, financial product or instrument; or to participate in any particular trading strategy. It does not take into account readers’ financial situation or investment objectives. We advise any readers of this content to seek their own advice. Without the approval of Pepperstone, reproduction or redistribution of this information isn’t permitted.
Global risk Warning CFDs are complex instruments and come with a high risk of losing money rapidly due to leverage. Between 74-89% of retail investor accounts lose money when trading in CFDs. You should consider whether you understand how CFD
Disclaimer
The information and publications are not meant to be, and do not constitute, financial, investment, trading, or other types of advice or recommendations supplied or endorsed by TradingView. Read more in the Terms of Use.