Updated
SPR/BTC end of downtrend
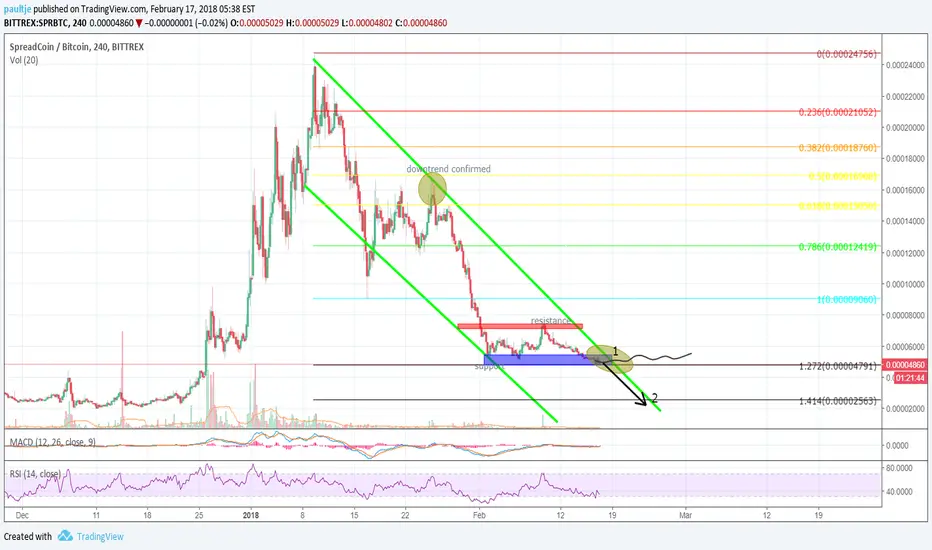
First of all, this is an educational chart. I am trying to understand how technical analysis work.
I outlined two scenarios:
1. Spreadcoin will hold support and accumulate (building momentum) before a new run.
2. Spreadcoin wont hold support and remains in downtrend. next support line: 1.414 fib line, around 2500sats
If you have any feedback or remarks, feel free to leave a comment.
I outlined two scenarios:
1. Spreadcoin will hold support and accumulate (building momentum) before a new run.
2. Spreadcoin wont hold support and remains in downtrend. next support line: 1.414 fib line, around 2500sats
If you have any feedback or remarks, feel free to leave a comment.
Note
UPDATEscenario 1 is invalid. Spreadcoin broke support downwards, now heading for 1.414 fib line, scenario 2 is more likely
Note
SPR broke out downtrend, accumulation time!Disclaimer
The information and publications are not meant to be, and do not constitute, financial, investment, trading, or other types of advice or recommendations supplied or endorsed by TradingView. Read more in the Terms of Use.
Disclaimer
The information and publications are not meant to be, and do not constitute, financial, investment, trading, or other types of advice or recommendations supplied or endorsed by TradingView. Read more in the Terms of Use.