Greeting there traders this is my analysis on
📊 S&P 500 – Potential Elliott Wave 3 Formation | Long Setup
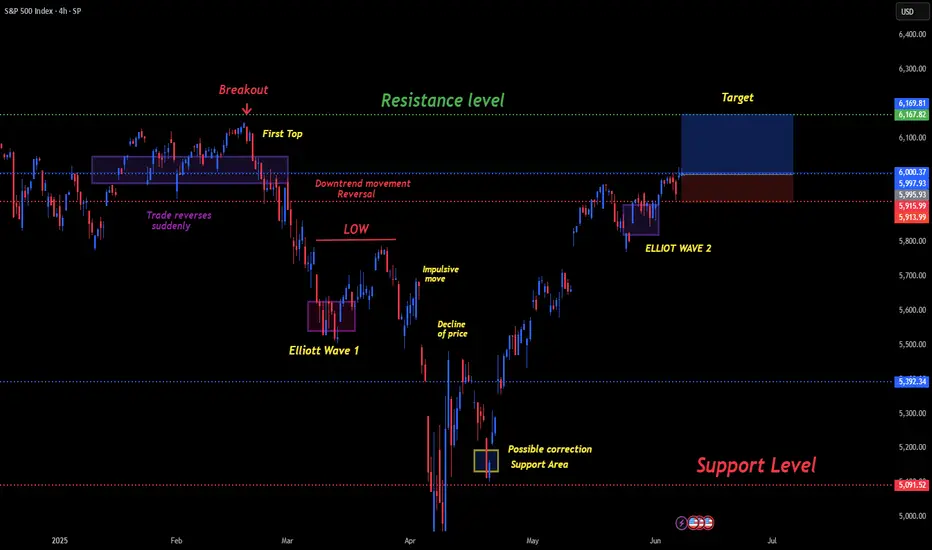
The current 4H chart of the S&P 500 suggests a potential bullish continuation based on Elliott Wave Theory. Here's the structured breakdown:
🔹 Wave 1: Initiated after a failed breakout and sharp reversal from a previous resistance zone. This impulsive move marked a key shift in trend structure.
🔹 Wave 2: A corrective phase followed, consolidating near the support area (~5,915), respecting previous demand.
🔹 Current Price Action: Price has broken above the minor resistance at 6,000, indicating the potential beginning of Wave 3, which is typically the strongest and most extended wave in the sequence.
📈 Trade Setup:
Entry: Above 6,000 (confirmation of breakout and wave continuation)
Stop Loss: Below 5,915 (invalidates bullish structure if broken)
Target Zone: 6,167 – 6,170 (aligned with prior resistance and wave projection)
🔍 Additional Notes:
The breakout is supported by a clean structure and rejection from key support.
Ideal scenario would involve increasing volume and continuation with higher highs and higher lows.
📌 Bias: Bullish – targeting Wave 3 extension.
⚠️ Always manage risk accordingly and watch for signs of exhaustion or divergence.
Dear Traders like,comment let me know what do you think?
📊 S&P 500 – Potential Elliott Wave 3 Formation | Long Setup
The current 4H chart of the S&P 500 suggests a potential bullish continuation based on Elliott Wave Theory. Here's the structured breakdown:
🔹 Wave 1: Initiated after a failed breakout and sharp reversal from a previous resistance zone. This impulsive move marked a key shift in trend structure.
🔹 Wave 2: A corrective phase followed, consolidating near the support area (~5,915), respecting previous demand.
🔹 Current Price Action: Price has broken above the minor resistance at 6,000, indicating the potential beginning of Wave 3, which is typically the strongest and most extended wave in the sequence.
📈 Trade Setup:
Entry: Above 6,000 (confirmation of breakout and wave continuation)
Stop Loss: Below 5,915 (invalidates bullish structure if broken)
Target Zone: 6,167 – 6,170 (aligned with prior resistance and wave projection)
🔍 Additional Notes:
The breakout is supported by a clean structure and rejection from key support.
Ideal scenario would involve increasing volume and continuation with higher highs and higher lows.
📌 Bias: Bullish – targeting Wave 3 extension.
⚠️ Always manage risk accordingly and watch for signs of exhaustion or divergence.
Dear Traders like,comment let me know what do you think?
Trade closed: target reached
Disclaimer
The information and publications are not meant to be, and do not constitute, financial, investment, trading, or other types of advice or recommendations supplied or endorsed by TradingView. Read more in the Terms of Use.
Disclaimer
The information and publications are not meant to be, and do not constitute, financial, investment, trading, or other types of advice or recommendations supplied or endorsed by TradingView. Read more in the Terms of Use.