Since the corona-pandemic lows seen in 2020 last year after the heavy market crashes the stock market and other important asset classes managed to recover in a strong manner, this was no wonder due to the fact that the money-supply increased in a way never seen previously in history to astronomical highs all this inflated money moving into the stock market and driving prices higher in an asset-price-inflation while the real economy still struggled to maintain this growth rate there reasoned a crucial gap between real economy and the stock market. All these events with the accelerating money stock shooted the inflation to the upside with a nearly 6.1% inflation in the US and in other countries including the european area also seeing higher and growing inflation rates. With the fact that production is still not what it was to pre-corona times meeting an increased demand with an increased money supply this is lying the ground for this devastating inflation rate, also when considering this assumption it has to be noted that it is not necessarily out of interest for the governments to stop the inflation as with ongoing inflation the depts states have been decreasing as together with the inflation the dept also simultaneously decreases, for now, we are already in dangerous terrain and if this inflation should accelerate further this can show serious outcomes with a crash upcoming not to be underestimated.
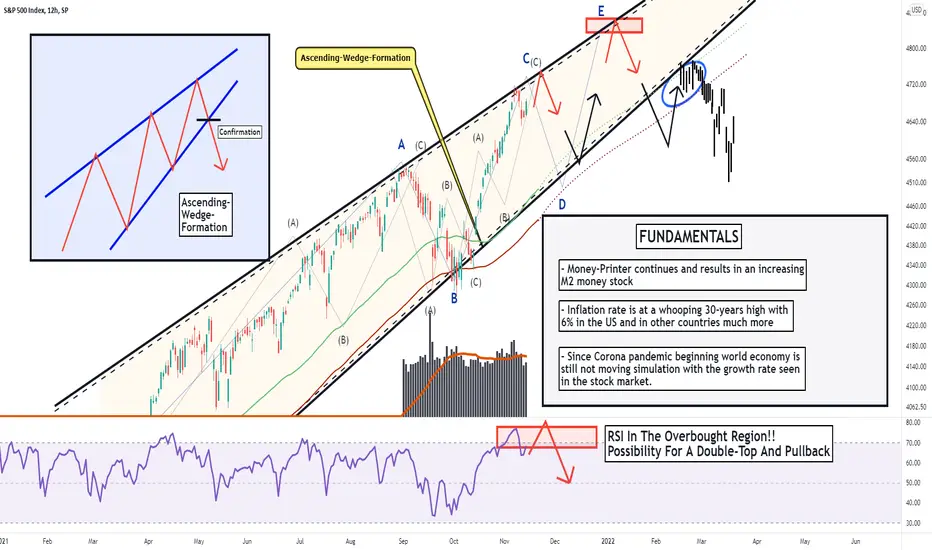
Taking this into consideration together with the technical assumptions as when looking at my chart we can watch there that the S&P 500 is already in a overbought condition with the RSI moving into the overbought zone, besides that we can see this huge ascending-wedge-formation forming with the waves A to C almost already completed, now as the SPX appraoches the upper boundary again this is likely to result in a pullback to the downside from where the SPX continues with the wave-count and development of the wave D in the structure to continue with the wave-E and then complete this whole formation bearishly. A bearish completion of this decisive ascending-wedge-formation would mean that the SPX will move on to lower levels. In this case the real economy growth rate and the stock market growth rate can meet to the proper condition. Nevertheless with a growing inflation and the inflation as it is up now together with the money stock increasing this is likely to bring fuel for a growing stock market also in the future, nevertheless, this is highly dangerous as such diverging circumstances can also lead to shifting dynamics with a gap in the financial system not functioning right like in the financial crisis in 2008 which will lead to the market crash, also a galloping or hyperinflation can lead to such shifting dynamics in the economy that lead to a crash. All these assumptions need to be considered in this market and therefore we are looking how it moves on and be prepared when important alterations set in.
In this manner, thank you for watching the analysis, it will be great when you support it with a like, follow and comment for more upcoming market analysis, all the best!
"The high destiny of the market is to explicate, rather than to speculate."
Information provided is only educational and should not be used to take action in the markets.
Note
The S&P 500 INDEX completed the wave-count exactly as mentioned to pullback the upper boundary and breakout below the lower boundary. The index continued with the further expected bearish alignements and reached out to the target-zones. ✔
Note
ANALYSIS UPDATE: The S&P 500 completed the massive ascending-triangle formation and exceeded all expectations in terms of the volatility breakout.►✅JOIN THE BEST+ TOP TELEGRAM TRADING CHANNEL: t.me/VincePrinceForexGoldStocks
►🚀Write To Join the Elite VIP Signal Channels: @Vince_Prince
►🔥JOIN BYBIT TOP EXCHANGE►🎁 UP TO $30,000 BONUS NOW: partner.bybit.com/b/VinceByBit
►🚀Write To Join the Elite VIP Signal Channels: @Vince_Prince
►🔥JOIN BYBIT TOP EXCHANGE►🎁 UP TO $30,000 BONUS NOW: partner.bybit.com/b/VinceByBit
Disclaimer
The information and publications are not meant to be, and do not constitute, financial, investment, trading, or other types of advice or recommendations supplied or endorsed by TradingView. Read more in the Terms of Use.
►✅JOIN THE BEST+ TOP TELEGRAM TRADING CHANNEL: t.me/VincePrinceForexGoldStocks
►🚀Write To Join the Elite VIP Signal Channels: @Vince_Prince
►🔥JOIN BYBIT TOP EXCHANGE►🎁 UP TO $30,000 BONUS NOW: partner.bybit.com/b/VinceByBit
►🚀Write To Join the Elite VIP Signal Channels: @Vince_Prince
►🔥JOIN BYBIT TOP EXCHANGE►🎁 UP TO $30,000 BONUS NOW: partner.bybit.com/b/VinceByBit
Disclaimer
The information and publications are not meant to be, and do not constitute, financial, investment, trading, or other types of advice or recommendations supplied or endorsed by TradingView. Read more in the Terms of Use.