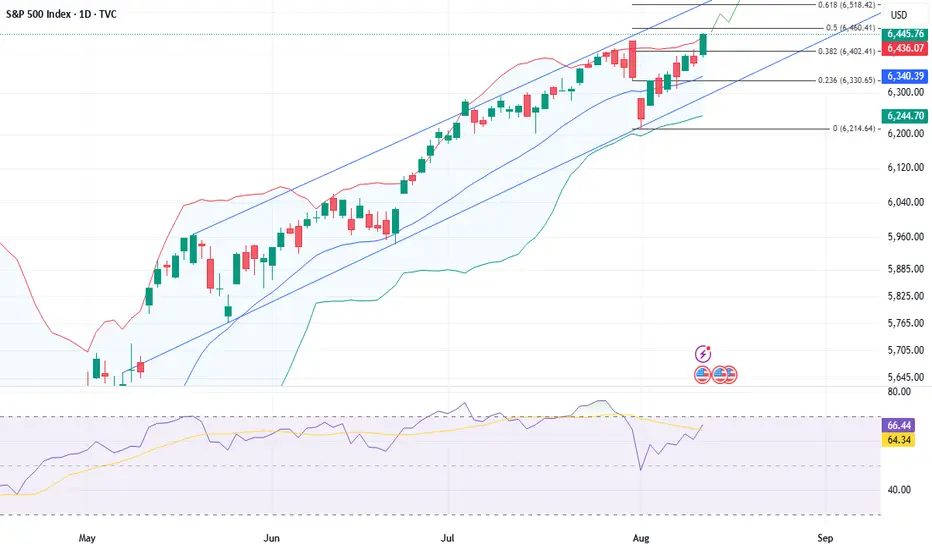
Technical Summary: The primary trend of the S&P 500 is bullish. On the 4H chart, the prices are trending bullish in an ascending channel formation. Prices are rising after reflecting from the lower trendline of the channel on Monday. The prices rose to an all-time high of 6445.75 after accepting support at the fib extension 0.382 at 6402.4. If prices successfully breach the immediate resistance at fib extension 0.50 at 6460.5, then it may rise to the far resistance zone between 6500 - 6518 (fib extension 0.618).
Descriptive Analysis: The S&P 500 notched a record close on Tuesday after consumer prices rose by less than expected in July, increasing the probability of the Federal Reserve cutting interest rates next month.
Data-related Projection: In the absence of key data releases today, market focus has shifted to tomorrow’s U.S. PPI report. U.S. stock markets are being underpinned by bullish sentiment, which is fueled by expectations of future rate cuts, possibly in the September Fed meeting.
Indicator Interpretation: The prices are trending higher in the buying zone of the technical indicators - above the middle Bollinger band and the mid-50 level of RSI.
ALTERNATIVE SCENARIO
Technical Confirmation: If the index fails to rise above fib extension 0.50 at 6460.5 and sustain, but falls below fib extension 0.382 at 6402.4, then further bearishness can be expected.
Facts & Figures: The S&P 500 is a very well-known index of large-cap US stocks, covering about 75% of all publicly traded US stocks. It comprises 505 stocks of 500 companies selected by a committee using 8 criteria.
Daily Pivot: 6420 (CMP: 6445.75, which is trading above the pivot level while writing the report).
Certified Market Technician
WA: +33755531401
marketinvestopedia.com/
WA: +33755531401
marketinvestopedia.com/
Disclaimer
The information and publications are not meant to be, and do not constitute, financial, investment, trading, or other types of advice or recommendations supplied or endorsed by TradingView. Read more in the Terms of Use.