The S&P 500 just logged its best quarterly performance since Q4 2023, surging on optimism around global trade negotiations and growing expectations that the Fed may begin cutting rates as early as September. US futures are green this morning, thanks to developments like Canada backing off digital taxes, ongoing dialogues with China ahead of the July 9 deadline, and risk-on sentiment is pushing yields and the dollar lower.
But as traders, we need to ask:
Are we witnessing a genuine economic inflection point? Or is this just a liquidity-driven rally that’s pricing in a best-case scenario?
Technical View
Possible Scenarios
The 'Soft Landing’ Is Now the Base Case
Markets are trading as if the Fed has successfully engineered a soft landing. But that’s now fully priced in, and historically, the most dangerous trades are the ones everyone agrees on. If trade talks stall, inflation re-accelerates, or earnings disappoint, the reversal could be brutal and fast.
Risk-on Sentiment Without Volume Is a Yellow Flag
Despite the price strength, volume has been tapering off. The S&P’s recent leg up occurred on lighter-than-average participation, suggesting institutions may be watching, not chasing. That’s often the case in low-volatility summers, but it also implies that any negative catalyst could cause outsized downside moves.
Macro-Fundamentals May Not Justify Valuation Expansion
Yes, inflation is slowing, and the Fed might cut. But if they do, it’s likely because growth is weakening, not because the economy is roaring. So the very condition that triggers rate cuts could also cap earnings growth!
Projection
Bullish Scenario: A confirmed breakout above 6,280 could carry us toward 6,400–6,500 by mid-Q3, especially if the trade deals progress, July inflation comes in soft, and the Fed signals accommodation.
Bearish Risk: If price fails to hold above 6,120, especially if trade optimism fades, or inflation growth spikes or Fed rhetoric shifts hawkish again, this could then open a quick pullback toward 6,000 or lower, which also aligns with the 50-day SMA.
Key Events to Watch
Conclusion
A record-setting quarter is impressive but not necessarily predictive. This quarter’s rally has been built more on relief and expectations than hard data. When expectations (not earnings) are doing the heavy lifting, any misstep from central banks or geopolitics could unravel gains rapidly.
A rate cut might be delayed, or inflation re-accelerates, or trade talks stall; any of these could leave equities hanging. Remember: the higher the climb without real earnings growth, the harder the fall when sentiment shifts. It's not just about the chart. It is about the narrative behind the price.
What’s your bias for Q3?
Are you buying this breakout or fading the optimism? Drop your thoughts below.
But as traders, we need to ask:
Are we witnessing a genuine economic inflection point? Or is this just a liquidity-driven rally that’s pricing in a best-case scenario?
Technical View
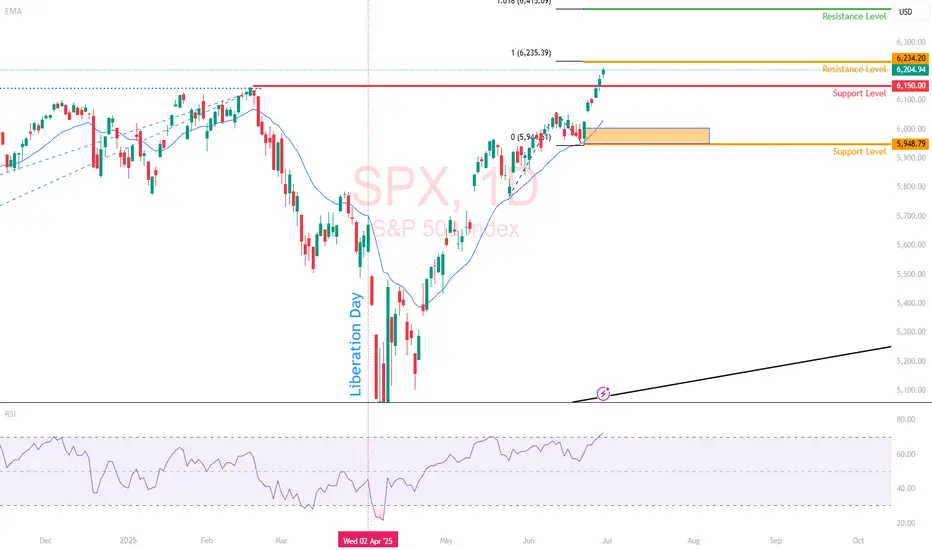
- Support Zone: 6,150 was just broken through. And 6000, the round number level, coinciding with the 20-day EMA and previous swing level.
- Resistance Levels: 6,235 is the next critical ceiling, a clean breakout could see price reach the extension level of 6,415.
- Momentum Indicators: RSI remains elevated and is creeping toward the overbought. While momentum is strong, watch out for the possible development of a divergence.
Possible Scenarios
The 'Soft Landing’ Is Now the Base Case
Markets are trading as if the Fed has successfully engineered a soft landing. But that’s now fully priced in, and historically, the most dangerous trades are the ones everyone agrees on. If trade talks stall, inflation re-accelerates, or earnings disappoint, the reversal could be brutal and fast.
Risk-on Sentiment Without Volume Is a Yellow Flag
Despite the price strength, volume has been tapering off. The S&P’s recent leg up occurred on lighter-than-average participation, suggesting institutions may be watching, not chasing. That’s often the case in low-volatility summers, but it also implies that any negative catalyst could cause outsized downside moves.
Macro-Fundamentals May Not Justify Valuation Expansion
Yes, inflation is slowing, and the Fed might cut. But if they do, it’s likely because growth is weakening, not because the economy is roaring. So the very condition that triggers rate cuts could also cap earnings growth!
Projection
Bullish Scenario: A confirmed breakout above 6,280 could carry us toward 6,400–6,500 by mid-Q3, especially if the trade deals progress, July inflation comes in soft, and the Fed signals accommodation.
Bearish Risk: If price fails to hold above 6,120, especially if trade optimism fades, or inflation growth spikes or Fed rhetoric shifts hawkish again, this could then open a quick pullback toward 6,000 or lower, which also aligns with the 50-day SMA.
Key Events to Watch
- July 9 Trade Talks Deadline: Any sign of stalling could bring volatility back fast.
- June CPI Print (July 10): Crucial for confirming the Fed's next move.
- Earnings Season Kickoff (mid-July): Tech-heavy expectations may not be easy to beat after such a strong run.
Conclusion
A record-setting quarter is impressive but not necessarily predictive. This quarter’s rally has been built more on relief and expectations than hard data. When expectations (not earnings) are doing the heavy lifting, any misstep from central banks or geopolitics could unravel gains rapidly.
A rate cut might be delayed, or inflation re-accelerates, or trade talks stall; any of these could leave equities hanging. Remember: the higher the climb without real earnings growth, the harder the fall when sentiment shifts. It's not just about the chart. It is about the narrative behind the price.
What’s your bias for Q3?
Are you buying this breakout or fading the optimism? Drop your thoughts below.
Join my mailing list jindaotai.com/joinme
Disclaimer
The information and publications are not meant to be, and do not constitute, financial, investment, trading, or other types of advice or recommendations supplied or endorsed by TradingView. Read more in the Terms of Use.
Join my mailing list jindaotai.com/joinme
Disclaimer
The information and publications are not meant to be, and do not constitute, financial, investment, trading, or other types of advice or recommendations supplied or endorsed by TradingView. Read more in the Terms of Use.