I won't use too many words here as the charts is pretty much self explanatory.
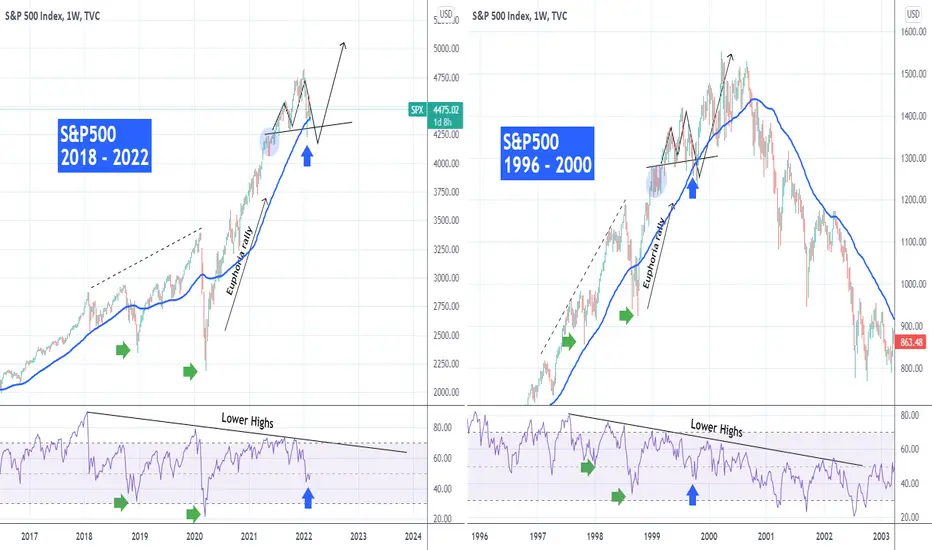
This is the S&P500 index today (on the left from 2018 to 2022) and the build up to the dotcom crash (1996 - 2000). I approach this symmetrically with 1997 and 2018 being the start of a highly volatile period where the RSI on the 1W time-frame started trading under Lower Highs i.e. showing a bearish divergence against the Higher Highs of the price's uptrend.
That period of volatility eventually came to an end and gave way to a massive rally led by euphoria, which gave the first sign of worries on a Head and Shoulders (H&S) pattern in 1999. It appears that this is where we are at now. In 1999, the H&S, despite breaking below the 1W MA50 (blue trend-line), didn't form a market top but eventually made one last fake rally to an All Time High (ATH) in March 2000. That was the market peak and as we all know the crash of the dotcom bubble took place and the index entered a Bear Market.
Does this mean S&P500 has one last ATH to give before a new dotcom like crash or this H&S already represents the market top for you? Or neither of the two and the stock market will continue upwards without such a crash? Let's make a heated discussion and let me know in the comments section below.
--------------------------------------------------------------------------------------------------------
** Please support this idea with your likes and comments, it is the best way to keep it relevant and support me. **
--------------------------------------------------------------------------------------------------------
👑Best Signals (Forex/Crypto+70% accuracy) & Account Management (+20% profit/month on 10k accounts)
💰Free Channel t.me/tradingshotglobal
🤵Contact info@tradingshot.com t.me/tradingshot
🔥New service: next X100 crypto GEMS!
💰Free Channel t.me/tradingshotglobal
🤵Contact info@tradingshot.com t.me/tradingshot
🔥New service: next X100 crypto GEMS!
Disclaimer
The information and publications are not meant to be, and do not constitute, financial, investment, trading, or other types of advice or recommendations supplied or endorsed by TradingView. Read more in the Terms of Use.