Hi,
S&P 500 price action has started to show some areas where we may get confirmed short-, mid-term movements.
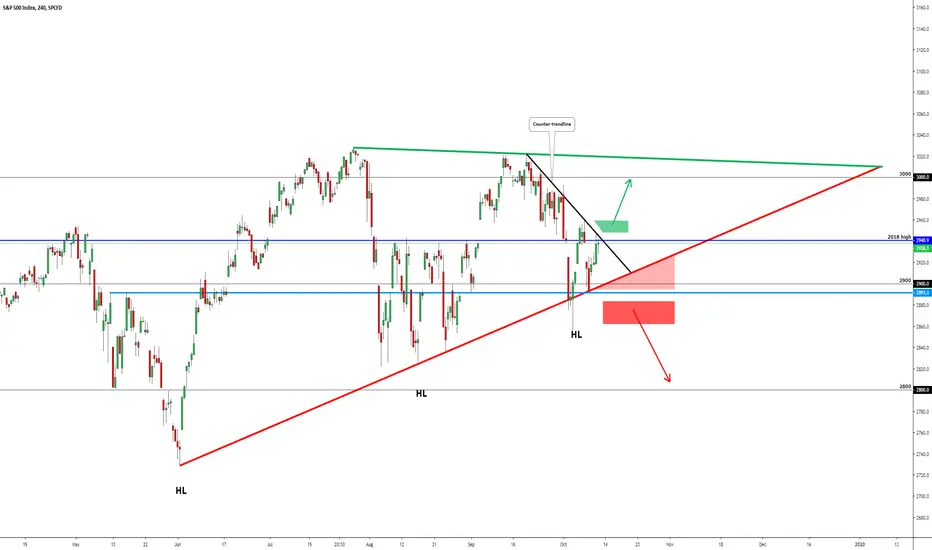
In general, since June the price has drawn a bullish chart pattern. It is not the textbook example but still, a bullish chart pattern called the Ascending Triangle. It has printed nice and clear higher lows (HL) and the upper trendline is almost horizontal - slightly lower high. This pattern can guide the price to the mid-term direction but after the breakout! At the moment, the price is inside of it and we cannot talk about mid-, long-term perspective.
S&P 500 price may go upwards if we get at least a 4H candle close above the counter trendline. This is not just a counter trendline break - if we get a candle close inside the green area then we have a:
1. Break above the black counter-trendline.
2. Break above the 1H EMA200
3. Break above the 4H EMA50&100
4. Break above the Daily EMA50
5. Break above the 2018 high at 2,940
A pretty heavy level to fight with on Friday but let's see what the price action starts to show us. If the 4H candle gets a close inside the marked green area, let's say above 2948, then there are pretty high chances that the price may go and test 3,000!
Bearish breakout is a bit further (obviously, it depends how heavily it falls) but the red trendline is the key.
It has held the price 5 times and if the red trendline breaks then there are some marked red areas where it may fall even lower.
If the price starts to move sideways, then there is a light-red triangle. If the price is inside of it, then be really cautious because we have a breakout from the chart Ascending Triangle. Yes, it is a bullish chart pattern but still, it is a triangle and breakouts can occur in either direction. So, watch out for that but the full bearish confirmation comes after the candle close inside the red rectangle:
1. Break below the Ascending Triangle
2. Break below the round number 2,900
3. Break below the mid of May resistance
4. New lower low candle close may release bears
5. Daily EMA200! Recently, it has held the price but be alerted if it breaks below the Daily EMA200.
6. 4H EMA Death Cross between 50&100. If the break below of those criteria then it will support that further move downwards.
If this scenario happens then the first target would be around 2,800.
If it was helpful then take a second and support my effort by hitting the "LIKE" button, it is my only fee from You!
Best regards,
Vaido
S&P 500 price action has started to show some areas where we may get confirmed short-, mid-term movements.
In general, since June the price has drawn a bullish chart pattern. It is not the textbook example but still, a bullish chart pattern called the Ascending Triangle. It has printed nice and clear higher lows (HL) and the upper trendline is almost horizontal - slightly lower high. This pattern can guide the price to the mid-term direction but after the breakout! At the moment, the price is inside of it and we cannot talk about mid-, long-term perspective.
S&P 500 price may go upwards if we get at least a 4H candle close above the counter trendline. This is not just a counter trendline break - if we get a candle close inside the green area then we have a:
1. Break above the black counter-trendline.
2. Break above the 1H EMA200
3. Break above the 4H EMA50&100
4. Break above the Daily EMA50
5. Break above the 2018 high at 2,940
A pretty heavy level to fight with on Friday but let's see what the price action starts to show us. If the 4H candle gets a close inside the marked green area, let's say above 2948, then there are pretty high chances that the price may go and test 3,000!
Bearish breakout is a bit further (obviously, it depends how heavily it falls) but the red trendline is the key.
It has held the price 5 times and if the red trendline breaks then there are some marked red areas where it may fall even lower.
If the price starts to move sideways, then there is a light-red triangle. If the price is inside of it, then be really cautious because we have a breakout from the chart Ascending Triangle. Yes, it is a bullish chart pattern but still, it is a triangle and breakouts can occur in either direction. So, watch out for that but the full bearish confirmation comes after the candle close inside the red rectangle:
1. Break below the Ascending Triangle
2. Break below the round number 2,900
3. Break below the mid of May resistance
4. New lower low candle close may release bears
5. Daily EMA200! Recently, it has held the price but be alerted if it breaks below the Daily EMA200.
6. 4H EMA Death Cross between 50&100. If the break below of those criteria then it will support that further move downwards.
If this scenario happens then the first target would be around 2,800.
If it was helpful then take a second and support my effort by hitting the "LIKE" button, it is my only fee from You!
Best regards,
Vaido
🔍I do the technicals - so You don’t have to.
📊Follow my research on Substack:
👉vaido.substack.com/ - ENG
👉vaidoveek.substack.com/ - EST
🚀 Actionable market analysis, ideas, and education
📊Follow my research on Substack:
👉vaido.substack.com/ - ENG
👉vaidoveek.substack.com/ - EST
🚀 Actionable market analysis, ideas, and education
Related publications
Disclaimer
The information and publications are not meant to be, and do not constitute, financial, investment, trading, or other types of advice or recommendations supplied or endorsed by TradingView. Read more in the Terms of Use.