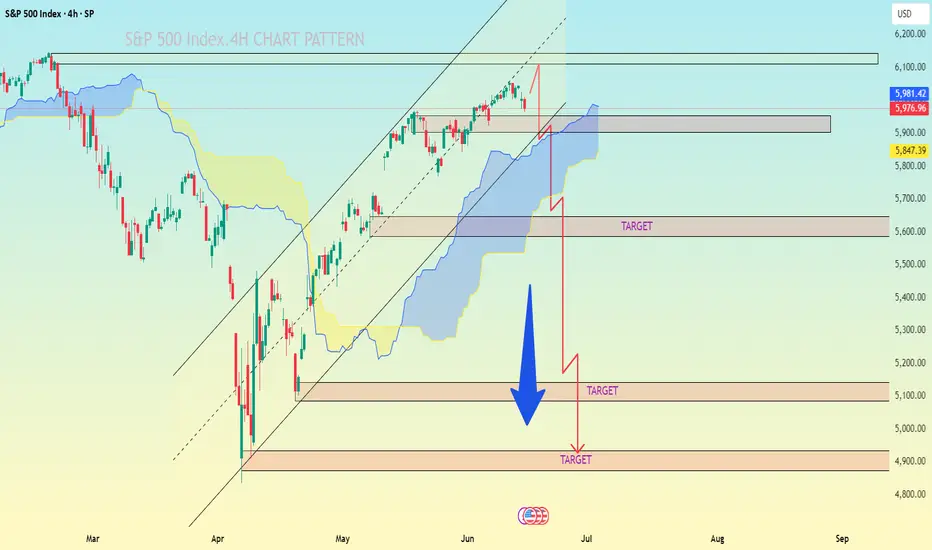
the S&P 500 Index (4H timeframe), it appears you're using a combination of Ichimoku Cloud, trend channels, and support/resistance zones to project downside targets. Here's the breakdown of your marked targets:
📉 Bearish Targets:
1. Target 1: Around 5,500
2. Target 2: Around 5,200
3. Target 3: Around 4,950–4,900
---
🔍 Technical Observations:
Price has broken below the upward trend channel.
It's entering the Ichimoku Cloud, signaling potential consolidation or bearish pressure.
The large blue downward arrow indicates a bearish expectation, possibly tied to macro/fundamental concerns or technical reversal patterns.
The grey resistance block near 5,960–6,000 suggests failed breakout/retest.
---
📌 Summary:
If current bearish momentum continues:
✅ Immediate Target: 5,500 (first major support)
⚠ Medium Target: 5,200
🔻 Final Target Zone: 4,900–4,950 (strong previous support and fib zone)
Let me know if you want stop-loss ideas, confluence indicators, or entry strategy breakdowns!
Trade active
active tradet.me/+yJ2-qfkocRg1NDlk
Forex, gold and crypto signal's with detailed analysis & get consistent results..
t.me/Jhonscalpertrade11
Gold signal's with proper TP & SL for high profits opportunities..
Forex, gold and crypto signal's with detailed analysis & get consistent results..
t.me/Jhonscalpertrade11
Gold signal's with proper TP & SL for high profits opportunities..
Related publications
Disclaimer
The information and publications are not meant to be, and do not constitute, financial, investment, trading, or other types of advice or recommendations supplied or endorsed by TradingView. Read more in the Terms of Use.
t.me/+yJ2-qfkocRg1NDlk
Forex, gold and crypto signal's with detailed analysis & get consistent results..
t.me/Jhonscalpertrade11
Gold signal's with proper TP & SL for high profits opportunities..
Forex, gold and crypto signal's with detailed analysis & get consistent results..
t.me/Jhonscalpertrade11
Gold signal's with proper TP & SL for high profits opportunities..
Related publications
Disclaimer
The information and publications are not meant to be, and do not constitute, financial, investment, trading, or other types of advice or recommendations supplied or endorsed by TradingView. Read more in the Terms of Use.