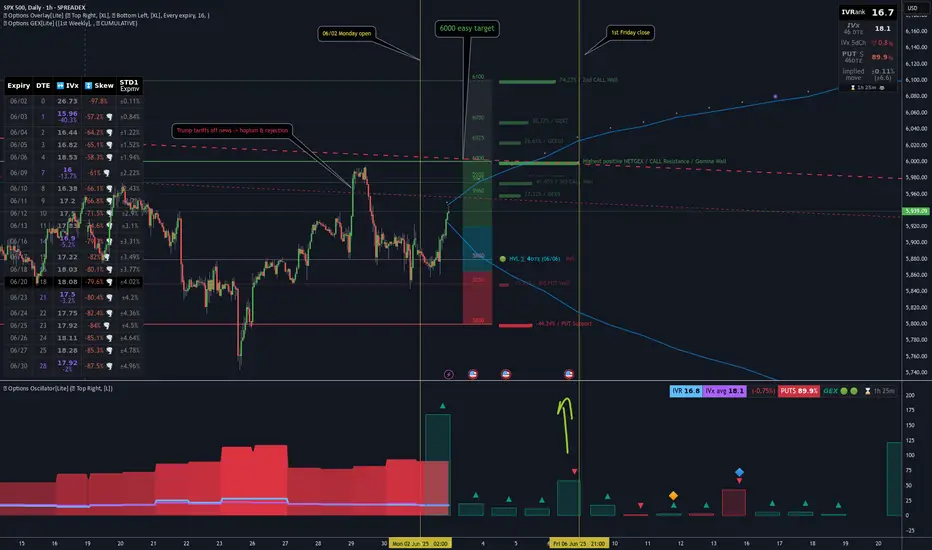
The biggest event last week was undoubtedly the court ruling involving Trump. The market responded with optimism, and on Thursday premarket, SPX surged toward the 6000 level — only to get instantly rejected. That strong rejection suggests this is a firm resistance zone.
From the GEX expiry matrix, it's clear that the market is hedging upward for this week, but downward for next week. To me, this indicates that while the near-term GEX sentiment remains slightly bullish, the market may be preparing for a pullback or retest in the medium term.

This week, SPX has already entered a GEX zone surrounded by positive strikes — up to around the 6000 level. That makes 6000 an “easy target” for bulls, and we’ll likely see profit-taking here, just like we did last Thursday premarket.
⚠️ However, if we look more closely at the weekly net open interest:

...we can see a strong bullish net OI build-up starting to emerge around the 6100 level — a price zone that currently feels distant and even unreachable. But if the 6000 resistance breaks, we could see a fast gamma-driven squeeze up to 6050 and possibly 6100 before the next wave of profit-taking kicks in.
As is often the case during bullish moves, the market seems blind to the bigger picture — no one’s looking down, only up. The mood is greedy, and momentum favors the bulls... for now.
Never underestimate FOMO — but also never underestimate Trump. He’s unlikely to accept the court’s decision on tariffs quietly. Any new negative headline could shake the market, no matter where price is sitting…
From the GEX expiry matrix, it's clear that the market is hedging upward for this week, but downward for next week. To me, this indicates that while the near-term GEX sentiment remains slightly bullish, the market may be preparing for a pullback or retest in the medium term.
This week, SPX has already entered a GEX zone surrounded by positive strikes — up to around the 6000 level. That makes 6000 an “easy target” for bulls, and we’ll likely see profit-taking here, just like we did last Thursday premarket.
⚠️ However, if we look more closely at the weekly net open interest:
...we can see a strong bullish net OI build-up starting to emerge around the 6100 level — a price zone that currently feels distant and even unreachable. But if the 6000 resistance breaks, we could see a fast gamma-driven squeeze up to 6050 and possibly 6100 before the next wave of profit-taking kicks in.
As is often the case during bullish moves, the market seems blind to the bigger picture — no one’s looking down, only up. The mood is greedy, and momentum favors the bulls... for now.
Never underestimate FOMO — but also never underestimate Trump. He’s unlikely to accept the court’s decision on tariffs quietly. Any new negative headline could shake the market, no matter where price is sitting…
Trade active
5990...will be the squeeze released to 6000 by this week or not? This is the question ⁉️Trade closed: target reached
🚀 Today we finally reached the 6000 level – a major milestone!There was a lot of hedging around here, and it was a huge target for the bulls.
The final stretch was a real grind, and as soon as we hit it, sellers immediately stepped in on the SPX. 📉
For now, it looks like a very strong resistance level. 💥
Boost up your charts with Options PRO!
REAL Options metrics for over 200+ liquid US symbols:
✔ 𝗔𝘂𝘁𝗼-𝗨𝗽𝗱𝗮𝘁𝗶𝗻𝗴 𝗚𝗘𝗫 𝗹𝗲𝘃𝗲𝗹𝘀
✔ GEX ✔ IVRank ✔ CALL/PUT skew ✔ Volatility✔ Delta curves
👉 7-day TRIAL 🌐 TanukiTrade.com
REAL Options metrics for over 200+ liquid US symbols:
✔ 𝗔𝘂𝘁𝗼-𝗨𝗽𝗱𝗮𝘁𝗶𝗻𝗴 𝗚𝗘𝗫 𝗹𝗲𝘃𝗲𝗹𝘀
✔ GEX ✔ IVRank ✔ CALL/PUT skew ✔ Volatility✔ Delta curves
👉 7-day TRIAL 🌐 TanukiTrade.com
Related publications
Disclaimer
The information and publications are not meant to be, and do not constitute, financial, investment, trading, or other types of advice or recommendations supplied or endorsed by TradingView. Read more in the Terms of Use.