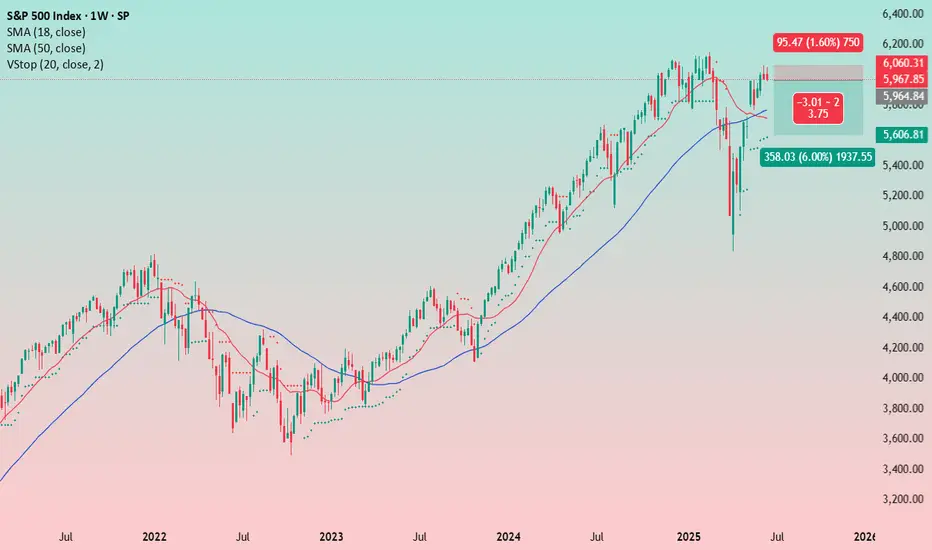
On the weekly chart, two clean red candles have formed. The price is struggling to move higher — every attempt to break above is being sold off.
An additional factor is geopolitical tension, which puts extra pressure on bullish momentum.
After such an exponential rally, I expect at least a pullback.
Could there be a new high and breakout above resistance? Yes, it's possible.
But the current setup offers a clear stop-loss just 1.60% below the current price — a small and comfortable risk.
This is not a quick trade. I plan to hold the position anywhere from 1 week to 1 month, depending on how the market develops. Therefore, I choose an optimal position size for my account, knowing that margin will be frozen.
Disclaimer
The information and publications are not meant to be, and do not constitute, financial, investment, trading, or other types of advice or recommendations supplied or endorsed by TradingView. Read more in the Terms of Use.
Disclaimer
The information and publications are not meant to be, and do not constitute, financial, investment, trading, or other types of advice or recommendations supplied or endorsed by TradingView. Read more in the Terms of Use.