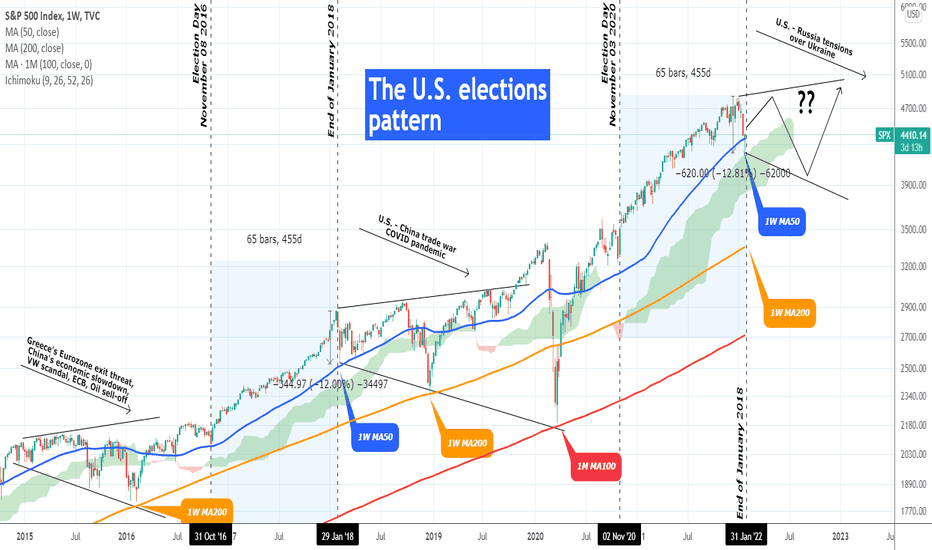
It has only been five months since I posted the following chart in January, calling for high yearly volatility ahead due to a U.S. elections pattern I discovered:
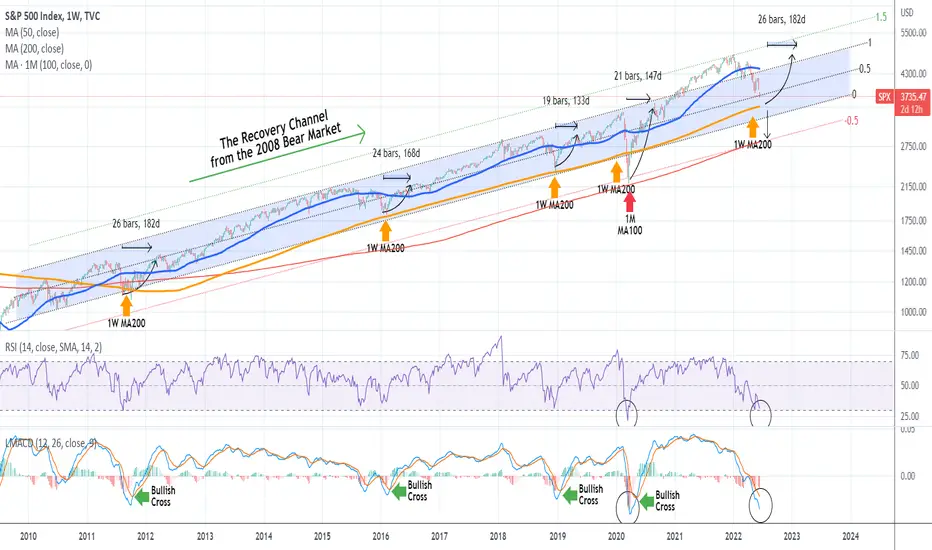
** The 2008 Recovery Channel **
Of course I didn't expect the S&P500 index (SPX) to reach its 1W MA200 (orange trend-line) that quickly, but still the chart was a right one. The index has made a new yearly low this week and this 1W chart displays the dynamics of the Channel Up the index has been trading in since it started recovering from the 2008 Bear Market. With the Fed Rate Decision today being pivotal to the stock markets' trend and a lot of market participants calling for a recession, it is useful to see what the long-term indicators are showing us.
** The 1W MA200 **
First of all as mentioned, it is very close to testing the 1W MA200, basically only 230 points (currently at 3502.96). Why all the talk about the 1W MA200? Because as you see on the chart, it has been the long-term Support of this 12 year Channel and has only broken significantly lower once on March 2020 during the COVID crash, which was a situation (economic lockdowns) completely new to the market. This is why I've included the -0.5 Fibonacci extension on the Channel because it shows that extreme, same as the 1.5 that shows the bullish extreme of the post COVID aggressive money printing to stimulate the economy.
** The 1W RSI and LMACD **
I believe the index will hit the 1W MA200 within a month's time and by then, the 1W RSI could be as low as during the COVID crash (March 16 2020). The 1W LMACD hasn't yet made a Bullish Cross but is very close to the COVID low. Every time the 1W MA200 is hit during these 12 years, an LMACD Bullish Cross has always confirmed the uptrend and recovery back to the prior Highs.
** We can recover by the end of the year **
So you may be wondering, what are the good news? Well, a very interesting stat is that on all those four occasions, it took S&P500 within 19 - 26 weeks from the moment it hit the 1W MA200 to reach its prior High. Assuming it hits the 1W MA200 by the end of July, we can recover the loss of this correction by the end of the year (or January 2023 tops). If the 1W MA200 fails to support the index and closes monthly candles below it, then it is more likely to see a strong crash to the 1M MA100 (red trend-line at 2826.50) as in the March 2020 COVID sell-off. Interestingly enough, the 1M MA100 is currently exactly on the -0.5 Fibonacci extension that supported the COVID crash.
Where do you think S&P500 will find support next?
--------------------------------------------------------------------------------------------------------
** Please support this idea with your likes and comments, it is the best way to keep it relevant and support me. **
--------------------------------------------------------------------------------------------------------
👑Best Signals (Forex/Crypto+70% accuracy) & Account Management (+20% profit/month on 10k accounts)
💰Free Channel t.me/tradingshotglobal
🤵Contact info@tradingshot.com t.me/tradingshot
🔥New service: next X100 crypto GEMS!
💰Free Channel t.me/tradingshotglobal
🤵Contact info@tradingshot.com t.me/tradingshot
🔥New service: next X100 crypto GEMS!
Disclaimer
The information and publications are not meant to be, and do not constitute, financial, investment, trading, or other types of advice or recommendations supplied or endorsed by TradingView. Read more in the Terms of Use.