Hi,
Do be honest, I discovered this "pattern" at the beginning of January and I presented this at the local conference of investment. At this time I didn't know it could happen SO fast, it was just a simple coincidence, but now it has come reality - the price of SP500 has started to approach super-aggressively old strong resistance levels which now becomes support!
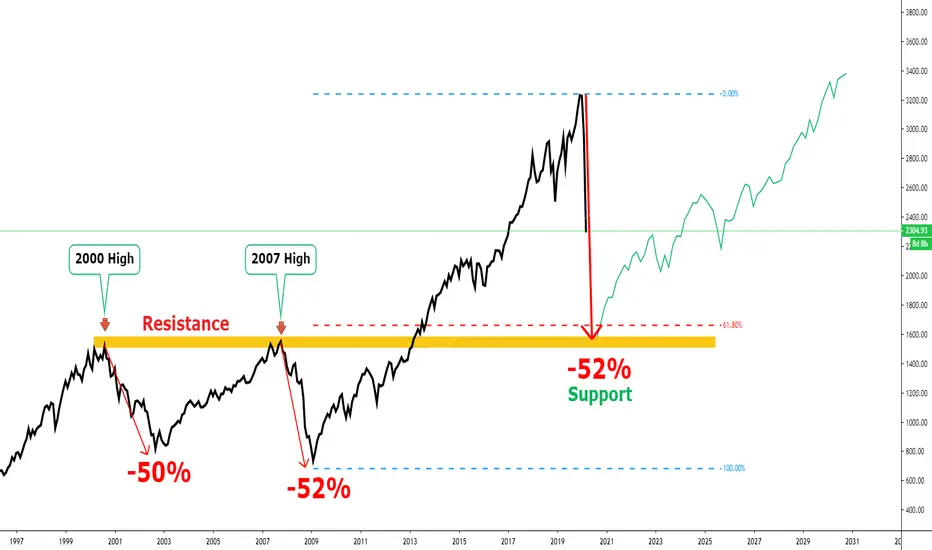
Those resistance levels are 2000 and 2007 yearly highs. Two times within one decade the price found resistance from the same price levels.
The resistance in 2000 pushed the price down and the price falls 50% from the peak. If you have seen my previous ideas about stocks then there is a "The club of 50%". It means if the price falls 50% from the last clean high (it would be better if it starts to fall from all-time high) then this price level starts to act as a strong support level, the support level "window" will stay between 47%-53% from the top. Example: from $200 to $100 and this $100 will act as a strong support).
...and here is a perfect example - the downwards movement which started in 2000, found a support level exactly after it dropped 50% from the top and the climb continued.
The climb continued until the price reached to 2000 yearly high in 2007, another crisis has started, the price starts to fall and we got another confirmation that 1500-1700 is a super strong resistance level.
After the tiny all-time high in 2007, the price starts to fall and again it founds a support level after the price is reached into "The club of 50%", it dropped 52% and perfectly matching with our 50% club window which was 47%-53% from the last peak.
....and the climb continued, another confirmation that those 50% drops are pretty powerful support levels. This climb which started in 2009 guided us to the longest and craziest bull run ever. Obviously, now it is over and we have a big question, where is the bottom of this crisis??
Where is the bottom, technically!?
Fast education:
1. The old clean resistance level becomes a support level.
2. A bit more specific but long-term Fibonacci levels are really powerful, and the most powerful Fibonacci retracement level is 62%, known as the Golden Ratio!
3. 50% drop from the all-time high starts to act as a support level (the window was 47%-53%)
Adding those criteria to the chart:
1. We have a super-powerful resistance level from the last decade. Two times, in 2000 and 2007, the price got a rejection from 1500-1700. The third time was a successful attempt and it guided the SP500 into the all-time-bull-run. After the breakout, this strong resistance level becomes a support level and as said previously, the price has started to approach it super-aggressively. So, the first major stop should stay between 1500-1700.
2. The Fibonacci Golden Ratio of 62% is waiting for the price around the same area as talked on the previous point, definitely adding strength to the mentioned support level.
3. The price fall, which began in 2000, found support after a 50% drop. The price fall, which began in 2007, found support after it dropped 52%. Now, from the all-time high to the previously discovered strong support area (1500-1700) is ~52%!!!
Long story short: start building your portfolio after the S&P500 has reached to the major support around 1500-1700! :)
Hopefully, it was helpful. Hopefully, it was informative and if you agree with me then hit the "LIKE" button! :)
Best regards,
Vaido
Do be honest, I discovered this "pattern" at the beginning of January and I presented this at the local conference of investment. At this time I didn't know it could happen SO fast, it was just a simple coincidence, but now it has come reality - the price of SP500 has started to approach super-aggressively old strong resistance levels which now becomes support!
Those resistance levels are 2000 and 2007 yearly highs. Two times within one decade the price found resistance from the same price levels.
The resistance in 2000 pushed the price down and the price falls 50% from the peak. If you have seen my previous ideas about stocks then there is a "The club of 50%". It means if the price falls 50% from the last clean high (it would be better if it starts to fall from all-time high) then this price level starts to act as a strong support level, the support level "window" will stay between 47%-53% from the top. Example: from $200 to $100 and this $100 will act as a strong support).
...and here is a perfect example - the downwards movement which started in 2000, found a support level exactly after it dropped 50% from the top and the climb continued.
The climb continued until the price reached to 2000 yearly high in 2007, another crisis has started, the price starts to fall and we got another confirmation that 1500-1700 is a super strong resistance level.
After the tiny all-time high in 2007, the price starts to fall and again it founds a support level after the price is reached into "The club of 50%", it dropped 52% and perfectly matching with our 50% club window which was 47%-53% from the last peak.
....and the climb continued, another confirmation that those 50% drops are pretty powerful support levels. This climb which started in 2009 guided us to the longest and craziest bull run ever. Obviously, now it is over and we have a big question, where is the bottom of this crisis??
Where is the bottom, technically!?
Fast education:
1. The old clean resistance level becomes a support level.
2. A bit more specific but long-term Fibonacci levels are really powerful, and the most powerful Fibonacci retracement level is 62%, known as the Golden Ratio!
3. 50% drop from the all-time high starts to act as a support level (the window was 47%-53%)
Adding those criteria to the chart:
1. We have a super-powerful resistance level from the last decade. Two times, in 2000 and 2007, the price got a rejection from 1500-1700. The third time was a successful attempt and it guided the SP500 into the all-time-bull-run. After the breakout, this strong resistance level becomes a support level and as said previously, the price has started to approach it super-aggressively. So, the first major stop should stay between 1500-1700.
2. The Fibonacci Golden Ratio of 62% is waiting for the price around the same area as talked on the previous point, definitely adding strength to the mentioned support level.
3. The price fall, which began in 2000, found support after a 50% drop. The price fall, which began in 2007, found support after it dropped 52%. Now, from the all-time high to the previously discovered strong support area (1500-1700) is ~52%!!!
Long story short: start building your portfolio after the S&P500 has reached to the major support around 1500-1700! :)
Hopefully, it was helpful. Hopefully, it was informative and if you agree with me then hit the "LIKE" button! :)
Best regards,
Vaido
Disclaimer
The information and publications are not meant to be, and do not constitute, financial, investment, trading, or other types of advice or recommendations supplied or endorsed by TradingView. Read more in the Terms of Use.
Disclaimer
The information and publications are not meant to be, and do not constitute, financial, investment, trading, or other types of advice or recommendations supplied or endorsed by TradingView. Read more in the Terms of Use.