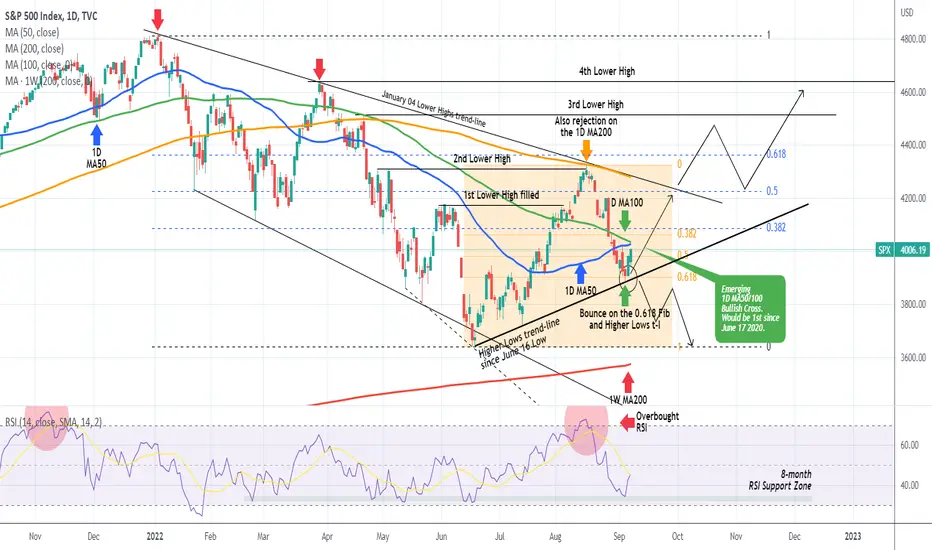
The S&P500 index (SPX) is staging its first strong rebound since the pull-back started on the August 16 High, a correction that we projected with our analysis below:
The downtrend has stopped on a hugely important Support cluster:
* First and foremost, it hit and rebounded on the 0.618 Fibonacci retracement level (orange one), which is technically known as the Golden Ratio.
* Secondly, it hit and rebounded exactly on the Higher Lows trend-line that started on the June 16 Low. That is the second contact made since.
* Thirdly, the 1D RSI hit and rebounded exactly on its 8-month Support Zone.
Among those Support levels, we should not overlook the highly critical emerging formation of the 1D MA50/100 Bullish Cross. That is when the 1D MA50 (blue trend-line) is crossing above the 1D MA100 (green trend-line), which is considered a technical bullish pattern. If crossed, it will be the first such pattern since the June 17 2020 formation, which was on the market recovery trend-line following the March 2020 COVID crash.
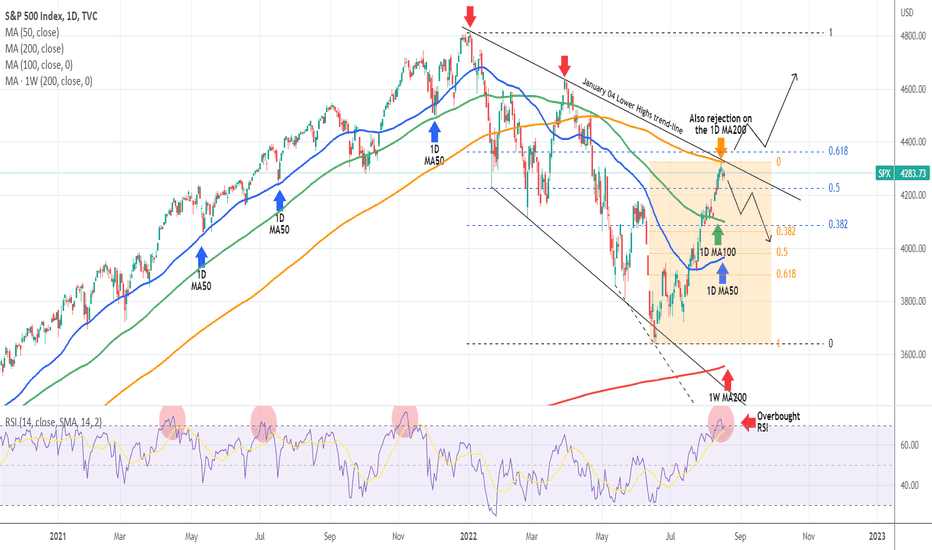
So where do all the above leave us now? We cannot ignore the big Resistance Zone of the 1D MA200 (orange trend-line) and the January 04 Lower Highs trend-line, that rejected the price on the Aug 16 top. Those are now exactly on top of each other and should be the first important test of the current rebound. A break/ candle close above them should target 4515 level, which is the 3rd Lower High of the downtrend that SPX needs to fill. As you see on the chart, the last two got filled and formed strong Resistance levels in August. At that point onwards, a re-test of the 1D MA200 as a Support, would fuel the uptrend to the All Time High test.
Extra attention is needed though at this stage as if the price is rejected again on the 1D MA50, the rebound attempt may end and if the pull-back causes a 1D candle to close below the 0.618 Fib, then the June Low can be tested and with that the ultimate Support of the 1W MA200 (red trend-line). Set your SLs exactly on the break-out points.
--------------------------------------------------------------------------------------------------------
** Please support this idea with your likes and comments, it is the best way to keep it relevant and support me. **
--------------------------------------------------------------------------------------------------------
The downtrend has stopped on a hugely important Support cluster:
* First and foremost, it hit and rebounded on the 0.618 Fibonacci retracement level (orange one), which is technically known as the Golden Ratio.
* Secondly, it hit and rebounded exactly on the Higher Lows trend-line that started on the June 16 Low. That is the second contact made since.
* Thirdly, the 1D RSI hit and rebounded exactly on its 8-month Support Zone.
Among those Support levels, we should not overlook the highly critical emerging formation of the 1D MA50/100 Bullish Cross. That is when the 1D MA50 (blue trend-line) is crossing above the 1D MA100 (green trend-line), which is considered a technical bullish pattern. If crossed, it will be the first such pattern since the June 17 2020 formation, which was on the market recovery trend-line following the March 2020 COVID crash.
So where do all the above leave us now? We cannot ignore the big Resistance Zone of the 1D MA200 (orange trend-line) and the January 04 Lower Highs trend-line, that rejected the price on the Aug 16 top. Those are now exactly on top of each other and should be the first important test of the current rebound. A break/ candle close above them should target 4515 level, which is the 3rd Lower High of the downtrend that SPX needs to fill. As you see on the chart, the last two got filled and formed strong Resistance levels in August. At that point onwards, a re-test of the 1D MA200 as a Support, would fuel the uptrend to the All Time High test.
Extra attention is needed though at this stage as if the price is rejected again on the 1D MA50, the rebound attempt may end and if the pull-back causes a 1D candle to close below the 0.618 Fib, then the June Low can be tested and with that the ultimate Support of the 1W MA200 (red trend-line). Set your SLs exactly on the break-out points.
--------------------------------------------------------------------------------------------------------
** Please support this idea with your likes and comments, it is the best way to keep it relevant and support me. **
--------------------------------------------------------------------------------------------------------
👑Best Signals (Forex/Crypto+70% accuracy) & Account Management (+20% profit/month on 10k accounts)
💰Free Channel t.me/tradingshotglobal
🤵Contact info@tradingshot.com t.me/tradingshot
🔥New service: next X100 crypto GEMS!
💰Free Channel t.me/tradingshotglobal
🤵Contact info@tradingshot.com t.me/tradingshot
🔥New service: next X100 crypto GEMS!
Disclaimer
The information and publications are not meant to be, and do not constitute, financial, investment, trading, or other types of advice or recommendations supplied or endorsed by TradingView. Read more in the Terms of Use.