Education: A bearish engulfing pattern is a technical chart pattern that signals lower prices to come. The pattern consists of an up (white or green) candlestick followed by a large down (black or red) candlestick that eclipses or "engulfs" the smaller up candle.
Do not ignore the BEAR in the market!
Do not ignore the BEAR in the market!
Note
keep inverse ETFs on your watch list!Note
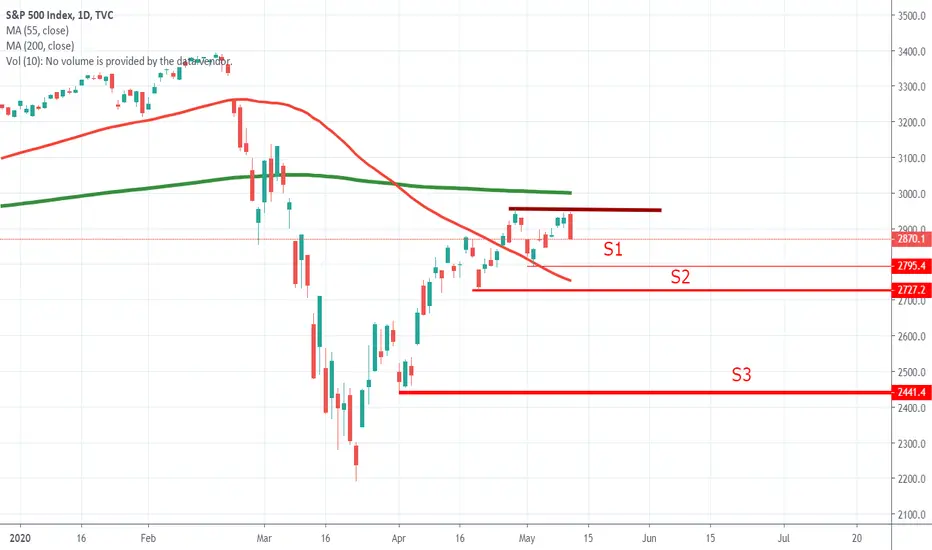
The first support level has been touched and S&P 500 closed below May 4th which make it more scary!Note
Lost the 1st Support levelUse the following link to access trading ideas: patreon.com/SniperTraderStocks?utm_medium=unknown&utm_source=join_link&utm_campaign=creatorshare_creator&utm_content=copyLink
Disclaimer
The information and publications are not meant to be, and do not constitute, financial, investment, trading, or other types of advice or recommendations supplied or endorsed by TradingView. Read more in the Terms of Use.
Use the following link to access trading ideas: patreon.com/SniperTraderStocks?utm_medium=unknown&utm_source=join_link&utm_campaign=creatorshare_creator&utm_content=copyLink
Disclaimer
The information and publications are not meant to be, and do not constitute, financial, investment, trading, or other types of advice or recommendations supplied or endorsed by TradingView. Read more in the Terms of Use.