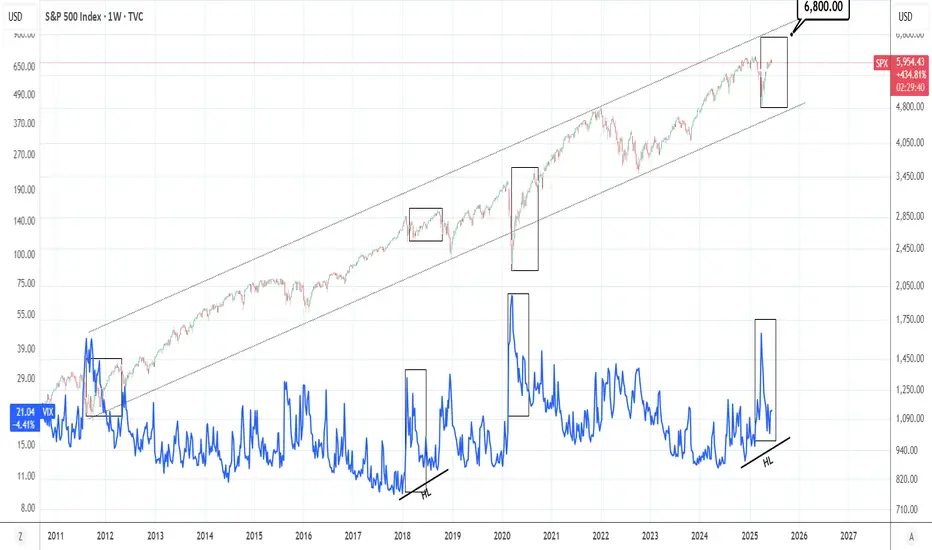
VIX has seen a strong decline in the past 2 months following the massive surge of Feb-March due to the Tariff War. In contrast, the S&P500 rose massively to almost its ATH, which is a natural response as the two assets are negatively correlated. This VIX pattern has been seen during every major market bottom in the past 15 years, the strongest of which was the 2020 COVID crash. This is a sign of a very bullish market, TP = 6,800 by the end of the year.
## If you like our free content follow our profile to get more daily ideas. ##
## Comments and likes are greatly appreciated. ##
## If you like our free content follow our profile to get more daily ideas. ##
## Comments and likes are greatly appreciated. ##
Telegram: t.me/investingscope
investingscope.com
Over 65% accuracy on Private Signals Channel.
Over 15% return monthly on our Account Management Plan.
Account RECOVERY services.
Free Channel: t.me/investingscopeofficial
investingscope.com
Over 65% accuracy on Private Signals Channel.
Over 15% return monthly on our Account Management Plan.
Account RECOVERY services.
Free Channel: t.me/investingscopeofficial
Disclaimer
The information and publications are not meant to be, and do not constitute, financial, investment, trading, or other types of advice or recommendations supplied or endorsed by TradingView. Read more in the Terms of Use.