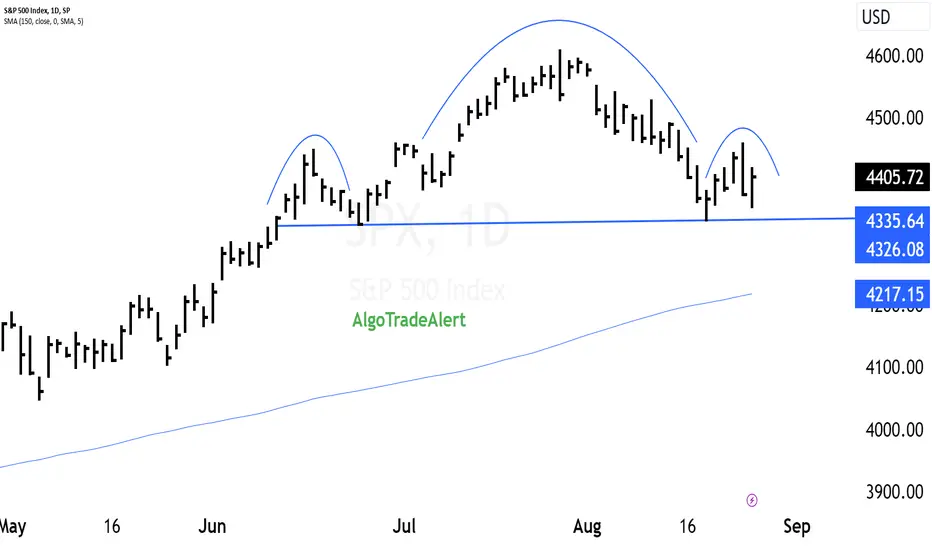
A **failed Head and Shoulders pattern** occurs when the expected trend reversal doesn't materialize as anticipated. In this scenario, the price doesn't continue downward after the completion of the pattern, defying the usual bearish implication. Instead, the price might continue its previous trend or move in an unexpected direction.
Several factors could contribute to the failure of a Head and Shoulders pattern:
1. **Lack of Volume**: Patterns are more reliable when accompanied by higher trading volumes during their formation. A lack of significant volume might weaken the pattern's predictive power.
2. **Market Sentiment Shift**: If there's a sudden shift in market sentiment or unexpected news that contradicts the pattern's implication, the pattern might fail to deliver the anticipated reversal.
3. **False Breakout**: The price might break below the neckline briefly, triggering a false bearish signal, but then quickly reverse and continue the previous upward trend.
4. **Timeframe Consideration**: The pattern's effectiveness can vary based on the timeframe it appears in. Patterns on shorter timeframes might be less reliable than those on longer timeframes.
5. **Price Volatility**: Excessive volatility could lead to erratic price movements, causing the pattern to lose its predictive value.
6. **Unusual Market Conditions**: Extraordinary events, such as government interventions or major economic shifts, could disrupt the pattern's typical behavior.
Investors and traders should exercise caution when interpreting technical patterns, as they are not foolproof predictors of future price movements. A failed pattern serves as a reminder that market behavior can be complex and influenced by a multitude of factors. It's crucial to consider additional technical indicators, fundamental analysis, and broader market context when making trading decisions.
Disclaimer
The information and publications are not meant to be, and do not constitute, financial, investment, trading, or other types of advice or recommendations supplied or endorsed by TradingView. Read more in the Terms of Use.
Disclaimer
The information and publications are not meant to be, and do not constitute, financial, investment, trading, or other types of advice or recommendations supplied or endorsed by TradingView. Read more in the Terms of Use.