Technical Analysis and Outlook:
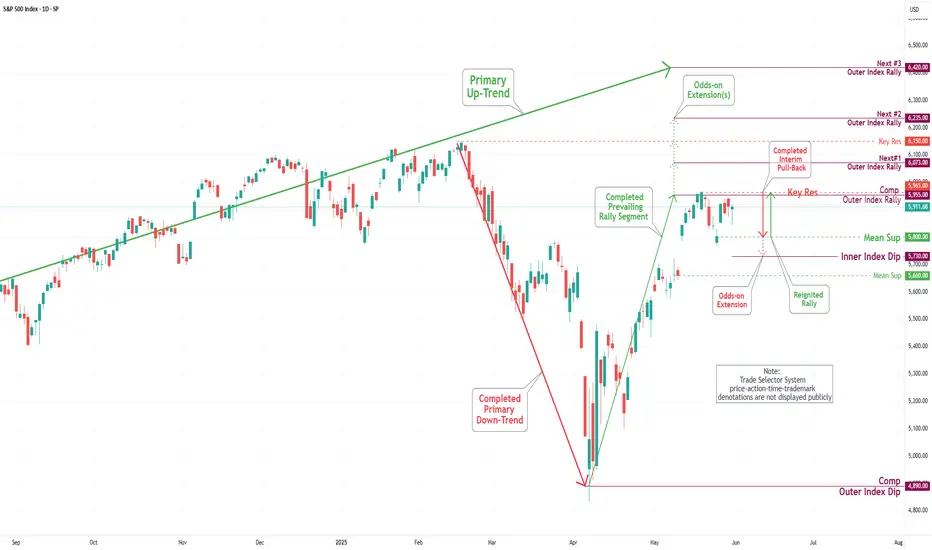
The S&P 500 Index has undergone considerable price fluctuations during the trading sessions of this week, successfully reaching a critical target at the Mean Support level of 5800. Presently, the index is exhibiting an upward trend with a focus on the retest of the Inner Index Dip at 5955 and Key Resistance at 5965. Furthermore, additional significant levels have been identified, including the Next#1 Outer Index Rally at 6073, Key Resistance at 6150, and the Next#2 Outer Index Rally at 6235. Conversely, there is a potential for the index prices to downfall aiming to retest Mean Support 5800 and to complete the Outer Index Dip, noted at 5730.
The S&P 500 Index has undergone considerable price fluctuations during the trading sessions of this week, successfully reaching a critical target at the Mean Support level of 5800. Presently, the index is exhibiting an upward trend with a focus on the retest of the Inner Index Dip at 5955 and Key Resistance at 5965. Furthermore, additional significant levels have been identified, including the Next#1 Outer Index Rally at 6073, Key Resistance at 6150, and the Next#2 Outer Index Rally at 6235. Conversely, there is a potential for the index prices to downfall aiming to retest Mean Support 5800 and to complete the Outer Index Dip, noted at 5730.
Related publications
Disclaimer
The information and publications are not meant to be, and do not constitute, financial, investment, trading, or other types of advice or recommendations supplied or endorsed by TradingView. Read more in the Terms of Use.
Related publications
Disclaimer
The information and publications are not meant to be, and do not constitute, financial, investment, trading, or other types of advice or recommendations supplied or endorsed by TradingView. Read more in the Terms of Use.