*Just an idea*
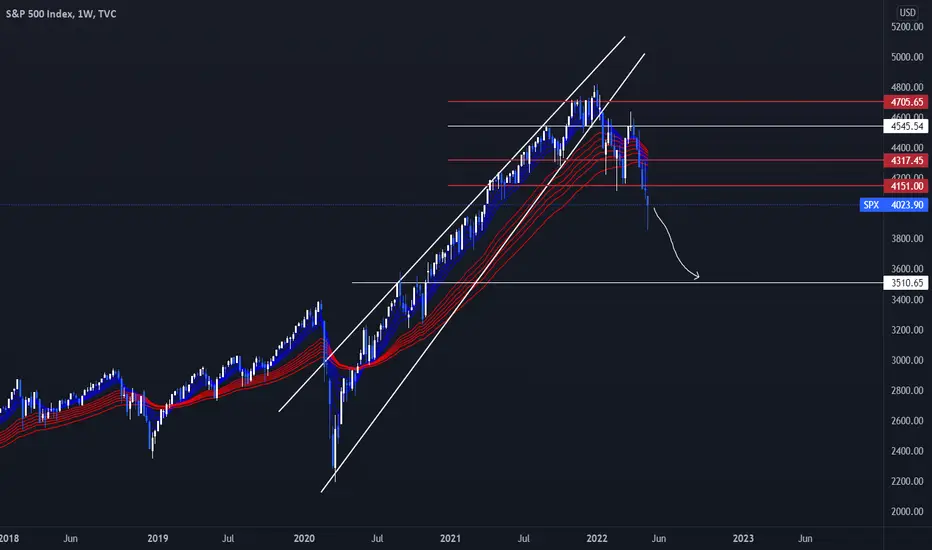
Weekly candles on SPX chart.
The indicator being used is GUPPY and we now see long-term & short-term investor EMA enter a downtrend.
Candles have closed below the final support line.
Weekly candles on SPX chart.
The indicator being used is GUPPY and we now see long-term & short-term investor EMA enter a downtrend.
Candles have closed below the final support line.
Disclaimer
The information and publications are not meant to be, and do not constitute, financial, investment, trading, or other types of advice or recommendations supplied or endorsed by TradingView. Read more in the Terms of Use.
Disclaimer
The information and publications are not meant to be, and do not constitute, financial, investment, trading, or other types of advice or recommendations supplied or endorsed by TradingView. Read more in the Terms of Use.