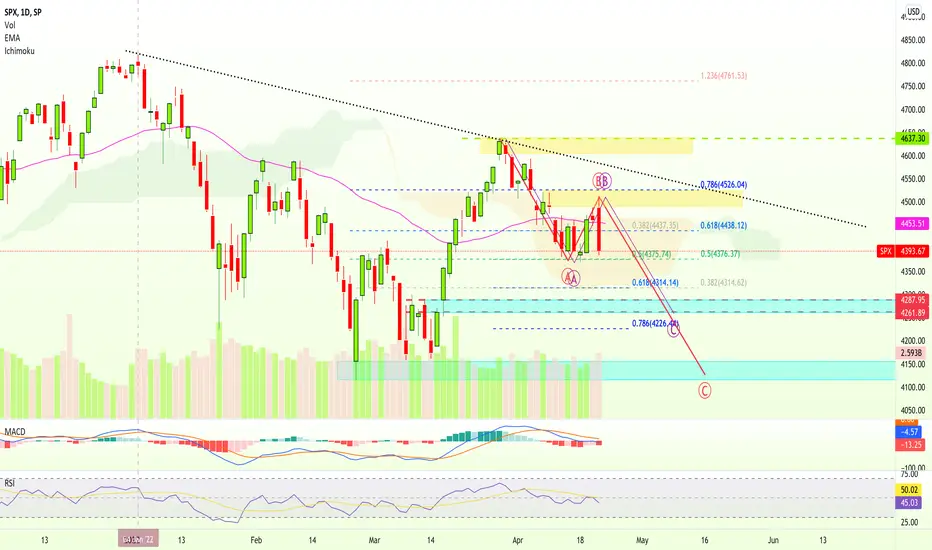
Three main indicators gone bearish for the S&P 500 Index (SPX) on the daily timeframe.
(1) SPX goes daily below EMA50 on a strong bearish candle with rising volume.
(2) MACD moves below zero entering the bearish zone.
(3) RSI goes below 50 going bearish.
These signals support my previous analysis a few days ago.
The peak happened in early January...
It has been dropping now for more than 3 months.
Namaste.
🚨 FREE PREMIUM Trades + Top Results
t.me/anandatrades/1183
🚨 FREE Quality Content + New Results
(Frequent Discounts & Offers)
t.me/masteranandatrades/6172
🚨 Go beyond! PREMIUM LIFETIME Access
lamatrades.com (Since 2017)
t.me/anandatrades/1183
🚨 FREE Quality Content + New Results
(Frequent Discounts & Offers)
t.me/masteranandatrades/6172
🚨 Go beyond! PREMIUM LIFETIME Access
lamatrades.com (Since 2017)
Related publications
Disclaimer
The information and publications are not meant to be, and do not constitute, financial, investment, trading, or other types of advice or recommendations supplied or endorsed by TradingView. Read more in the Terms of Use.