
📊 Weekly GEX Map (SPX)
This week’s GEX profile looks nearly identical to last week:

⚠️ What Happens If 5950 Fails?
In that case - welcome to negative gamma territory:
Result:
If we drop below 5950, we might see acceleration instead of stabilization — despite the positive GEX profile.
💡 Trade Idea of the Week – With Caution
If not for Wednesday's macro risk (Fed rate decision), I'd suggest a bullish diagonal spread toward 6100–6150:

But with FOMC looming, I'd only hold this trade until Thursday and close once the debit doubles or earlier.
🧨 Macro + Geo Risks
Fed is priced for “no move” → any surprise = volatility spike
Rising tensions with Iran → oil and futures could react violently
Recommendation: Avoid OIL this week, especially futures and naked strategies
🛡️ Prefer Downside Protection?
If you expect weakness on SPX weekly:

Consider a put debit spread with the short leg at 5950, where the second strongest Put Support sits.
This type of structure can offer up to 6:1 reward-to-risk, making it one of the most efficient bearish hedges for this week.
If you enjoyed the above breakdown, feel free to check out my previous weekly analyses or explore my tools as well.
Until next time – Trade what you see, not what you hope,
– Greg @ TanukiTrade
This week’s GEX profile looks nearly identical to last week:
- Positive bias above 6020 up to 6100
- But a sticky chop zone remains from 5975 to 6020
- Below 5950? That’s where things get interesting…
⚠️ What Happens If 5950 Fails?
In that case - welcome to negative gamma territory:
- Delta becomes unstable → fast, erratic moves
- Gamma loses influence → hedging effectiveness drops
- Dealer hedging lags → market makers chase, not lead
- Vega + theta distort readings → charm decay accelerates
Result:
- GEX zones lose clarity.
- Pinning breaks down.
- Reactions become nonlinear and emotional.
If we drop below 5950, we might see acceleration instead of stabilization — despite the positive GEX profile.
💡 Trade Idea of the Week – With Caution
If not for Wednesday's macro risk (Fed rate decision), I'd suggest a bullish diagonal spread toward 6100–6150:
- Limited downside
- Defined risk
- Covers the full squeeze zone
But with FOMC looming, I'd only hold this trade until Thursday and close once the debit doubles or earlier.
🧨 Macro + Geo Risks
Fed is priced for “no move” → any surprise = volatility spike
Rising tensions with Iran → oil and futures could react violently
Recommendation: Avoid OIL this week, especially futures and naked strategies
🛡️ Prefer Downside Protection?
If you expect weakness on SPX weekly:
Consider a put debit spread with the short leg at 5950, where the second strongest Put Support sits.
This type of structure can offer up to 6:1 reward-to-risk, making it one of the most efficient bearish hedges for this week.
If you enjoyed the above breakdown, feel free to check out my previous weekly analyses or explore my tools as well.
Until next time – Trade what you see, not what you hope,
– Greg @ TanukiTrade
Trade active
Just like last week: - 6050 tested
- 6050 failed
- now we are going to the transition zone and to the negative GEX territory
Note
📢 06/18 FOMC Interest Rate & 0DTE GEX Update📊 Unusually Wide 0DTE GEX Range
The current SPX 0DTE GEX range is extremely wide — I honestly can’t recall the last time I saw this 2 hours before expiry.
Market participants are heavily — and quite evenly — hedged on both sides:
🟢 Call side (bullish camp) is positioned around the 6035–6040 range, which is ~12–15 OTM delta from the current spot price.
🔴 Put side (bearish targets) are concentrated around 5910–5915, a 6–7 OTM delta — which would seem extreme on a regular day, but is completely normal on a high-impact macro day like today.
---
🧭 What the Market Is Signaling
This tells me that the market is anticipating a significant directional move in SPX after the FOMC announcement, from the current 5995–6000 zone — regardless of direction.
We’ve been stuck in this “limbo” zone for nearly 2 weeks now, and dealers are clearly bracing for a break.
The hedged zone today is 5910–6040.
If we stay within this zone, we might just see a directional drift — no major gamma squeeze.
But if we break outside this range post-FED and a gamma squeeze triggers (either positive or negative), it could seriously destabilize the market — especially to the downside, where emotional panic could escalate fast.
Trade closed: target reached
Quad Witching: We've closed right at this week's PUT support (5970–5975)Note
[06/30] Weekly Update: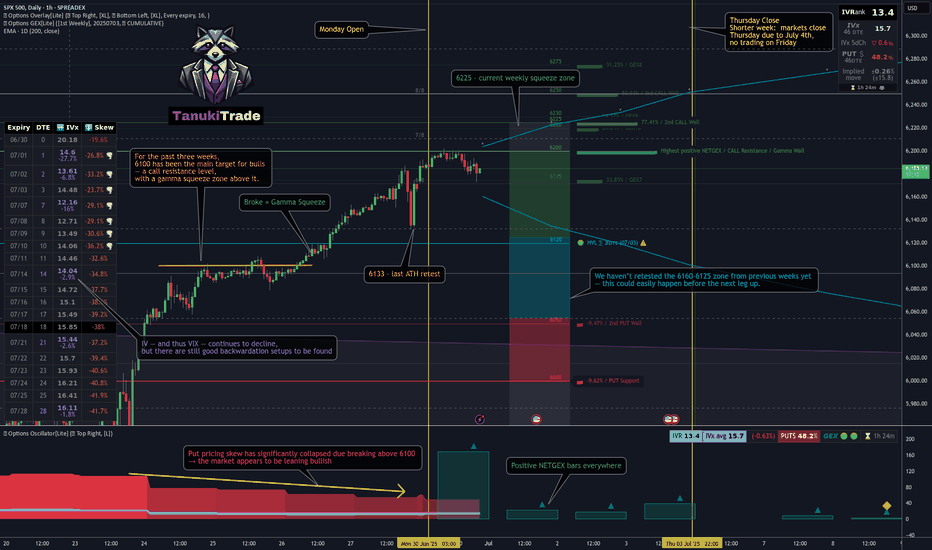
Boost up your charts with Options PRO!
REAL Options metrics for over 200+ liquid US symbols:
✔ 𝗔𝘂𝘁𝗼-𝗨𝗽𝗱𝗮𝘁𝗶𝗻𝗴 𝗚𝗘𝗫 𝗹𝗲𝘃𝗲𝗹𝘀
✔ GEX ✔ IVRank ✔ CALL/PUT skew ✔ Volatility✔ Delta curves
👉 7-day TRIAL 🌐 TanukiTrade.com
REAL Options metrics for over 200+ liquid US symbols:
✔ 𝗔𝘂𝘁𝗼-𝗨𝗽𝗱𝗮𝘁𝗶𝗻𝗴 𝗚𝗘𝗫 𝗹𝗲𝘃𝗲𝗹𝘀
✔ GEX ✔ IVRank ✔ CALL/PUT skew ✔ Volatility✔ Delta curves
👉 7-day TRIAL 🌐 TanukiTrade.com
Related publications
Disclaimer
The information and publications are not meant to be, and do not constitute, financial, investment, trading, or other types of advice or recommendations supplied or endorsed by TradingView. Read more in the Terms of Use.