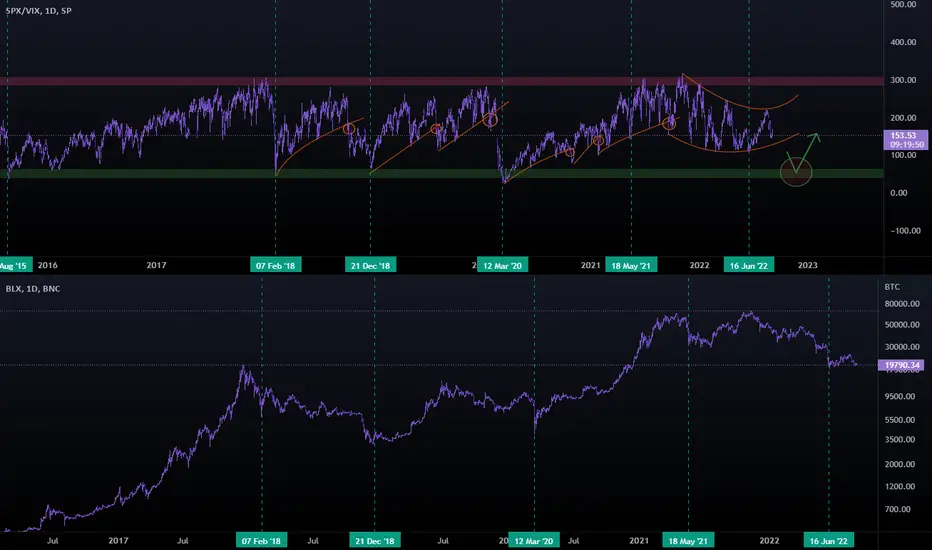
SPX/VIX has been signaling all the best buys and sells for the past few years and it will be a very crutial chart to look at when willing to invest. Here we can see all trends reversals according to stocks and markets sentiment. All touches of the green area have been a great buy opportunity and as you can see - we are nowhere near it yet - sentiment is still heading there.
Right now moving in a curvy channel reversing to the upside - we need to monitor if the chart will bounce within that channel up, or cross it.
Crossing it down will signal a strong bearish momentum and we should act accordingly.
All SPX/VIX dips are marked on BTC aswell - you don't want to miss it.
Right now moving in a curvy channel reversing to the upside - we need to monitor if the chart will bounce within that channel up, or cross it.
Crossing it down will signal a strong bearish momentum and we should act accordingly.
All SPX/VIX dips are marked on BTC aswell - you don't want to miss it.
Disclaimer
The information and publications are not meant to be, and do not constitute, financial, investment, trading, or other types of advice or recommendations supplied or endorsed by TradingView. Read more in the Terms of Use.
Disclaimer
The information and publications are not meant to be, and do not constitute, financial, investment, trading, or other types of advice or recommendations supplied or endorsed by TradingView. Read more in the Terms of Use.