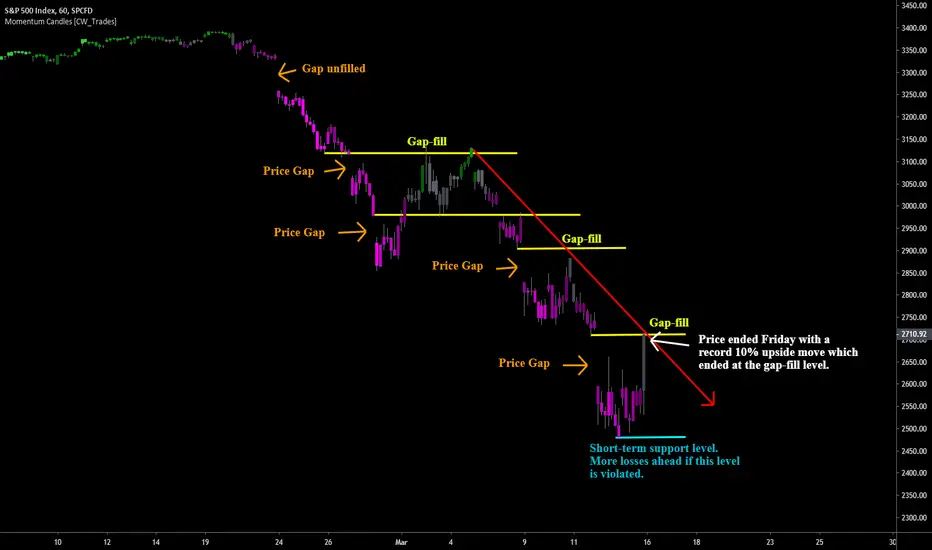
A look at the S&P 500 hourly chart shows numerous gaps created and filled, with most rejected, as price made a series of new lows at the open of each new trading day. Nearly every gap so far has been filled followed promptly by more selling. Friday’s record 10% move up on the state of emergency declaration saw price stop right at the most recent gap-fill level as well as the red downtrend line. Monday’s opening move will be an indication of what to expect in the short-term. A continued move higher would be bullish, while a rejection at the gap level and downtrend line would be bearish and likely lead to a re-test of the recent lows. A push below recent lows would likely lead to more selling ahead for markets.
Disclaimer
The information and publications are not meant to be, and do not constitute, financial, investment, trading, or other types of advice or recommendations supplied or endorsed by TradingView. Read more in the Terms of Use.
Disclaimer
The information and publications are not meant to be, and do not constitute, financial, investment, trading, or other types of advice or recommendations supplied or endorsed by TradingView. Read more in the Terms of Use.