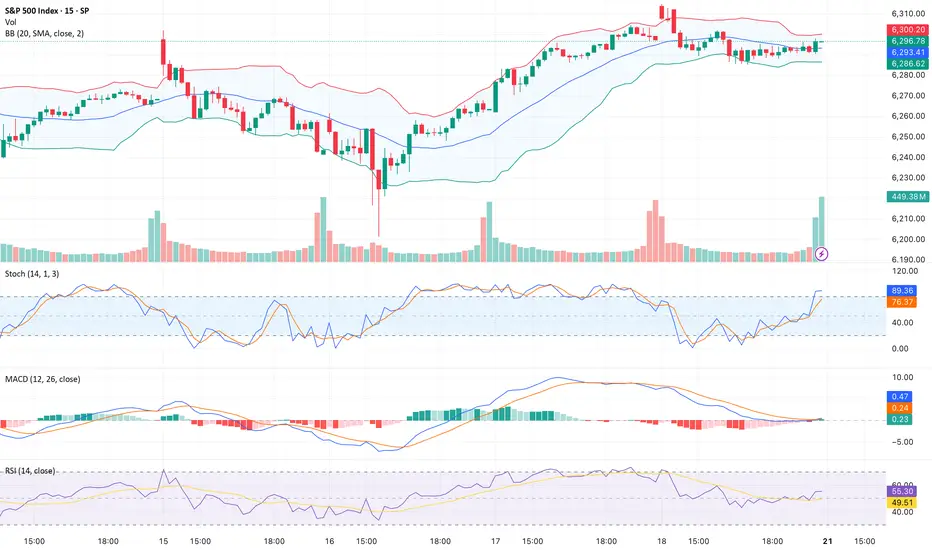
This is a 15-minute timeframe chart, where each candlestick represents 15 minutes of trading activity. It is primarily used by intraday traders and scalpers to identify short-term trends, breakout zones, and momentum plays.
This chart of the S&P 500 (SPX) reflects intraday movements with real-time tracking of support/resistance zones, volume spikes, and short-term patterns.
This chart of the S&P 500 (SPX) reflects intraday movements with real-time tracking of support/resistance zones, volume spikes, and short-term patterns.
Disclaimer
The information and publications are not meant to be, and do not constitute, financial, investment, trading, or other types of advice or recommendations supplied or endorsed by TradingView. Read more in the Terms of Use.
Disclaimer
The information and publications are not meant to be, and do not constitute, financial, investment, trading, or other types of advice or recommendations supplied or endorsed by TradingView. Read more in the Terms of Use.