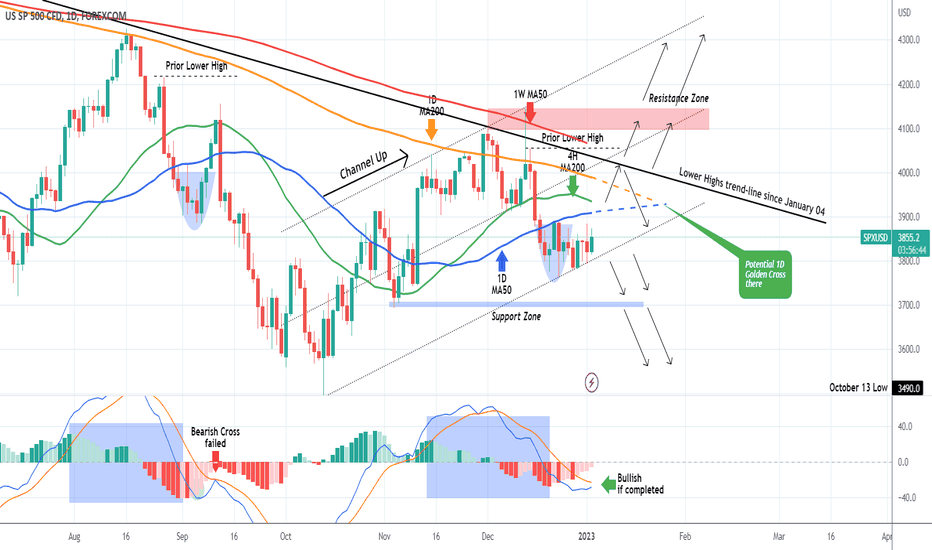
The S&P500 index (SPX) has been trading within a Channel Up as we showed on our last analysis, struggling to break above its 1D MA50:
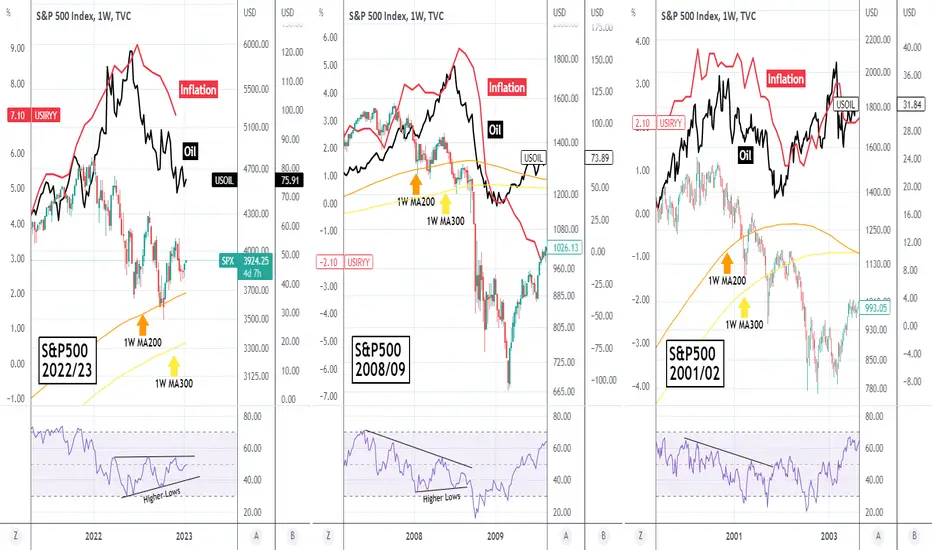
On the current analysis, we switch back to the longer-term dynamics and compare the 2022/23 correction (so far) to the previous Bear Cycles of 2008/09 and 2001/02, using the parameters of Inflation (red trend-line) and WTI Oil (black trend-line).
At the moment, the S&P500 is above its 1W MA200 (orange trend-line) with the 1W RSI on Higher Lows, within an Ascending Triangle pattern since the May 16 Low. This can make all the difference during the current inflation crisis. The reason is that this pattern is different from the 1W RSI Higher Lows within a Falling Wedge of 2008/09 and just the Lower Highs of 2001/02.
As you see in 2008, the index was supported on the 1W MA200 as well and posted a counter-trend rally before eventually breaking it, and the break below the 1W MA300 (yellow trend-line), practically opened the way for the more violent second part of the Bear Cycle. Same with 2001 where however the 1W MA200 didn't have as a significant role.
Inflation in all cases started to drop significantly after the Bear Cycle started, Oil seems to precede/ lead this fall, and (Oil's) current structure looks more like that (bottom fractal) of January 2009 and January 2002. Mere coincidence that we are now in January 2022?
Right now both the 1W RSI structure as well as the candles are different than before, being evidently slightly more bullish (so far). Can this RSI bullish divergence be enough to keep S&P500 above the 1W MA200 and start to rise to its first Higher High, effectively invalidating the Bear Cycle or history will repeat itself with another violent break below the 1W MA300?
-------------------------------------------------------------------------------
** Please LIKE 👍, FOLLOW ✅, SHARE 🙌 and COMMENT ✍ if you enjoy this idea! Also share your ideas and charts in the comments section below! **
-------------------------------------------------------------------------------
💸💸💸💸💸💸
👇 👇 👇 👇 👇 👇
👑Best Signals (Forex/Crypto+70% accuracy) & Account Management (+20% profit/month on 10k accounts)
💰Free Channel t.me/tradingshotglobal
🤵Contact info@tradingshot.com t.me/tradingshot
🔥New service: next X100 crypto GEMS!
💰Free Channel t.me/tradingshotglobal
🤵Contact info@tradingshot.com t.me/tradingshot
🔥New service: next X100 crypto GEMS!
Disclaimer
The information and publications are not meant to be, and do not constitute, financial, investment, trading, or other types of advice or recommendations supplied or endorsed by TradingView. Read more in the Terms of Use.