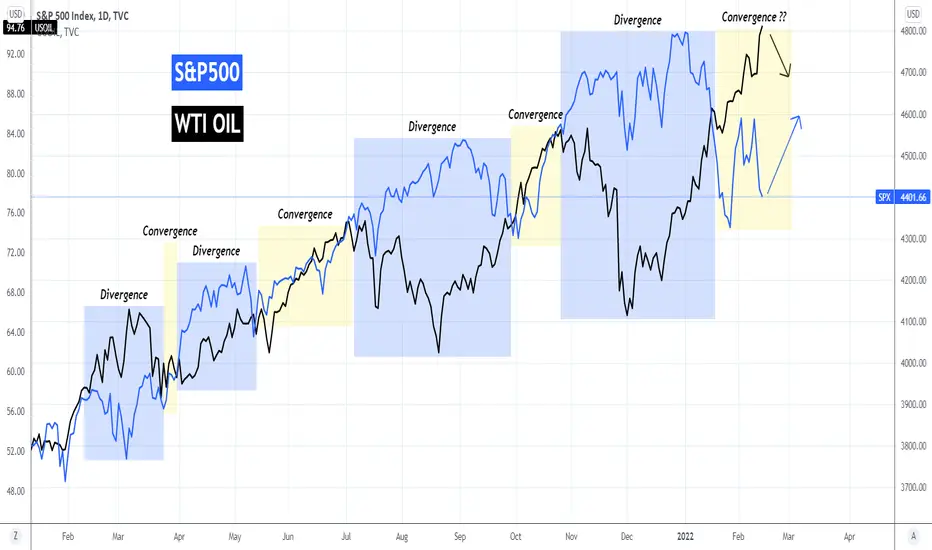
Ever since the COVID recovery started, both the S&P500 index and the WTI Oil, have followed similar courses, especially since the start of 2021. There is a very interesting pattern of divergence and convergence, which the two follow on a consistent basis.
As this chart on the 1D time-frame shows, when S&P500 (blue trend-line) diverges from the shared upward path with WTI (black trend-line), within the blue zone, they have always converged back (yellow zone). Ever since mid January 2022, it is WTI that diverged from the S&P500 as the index dropped violently while WTI continued its rapid price growth. Last time this happened was in the mid Feb 2021 - mid March 2021 Divergence, as the other two Divergence Phases, it was the S&P500 that rapidly expanded while WTI was correcting.
Naturally, if this pattern continues to play out, we should now have a new Convergence phase where the two assets cross trend-lines again and continue their course when they will eventually diverge again. This means that we should be expecting S&P to recover while WTI pulls back from its current highs.
Do you think that will be the case? Let me know in the comments section below.
--------------------------------------------------------------------------------------------------------
Please like, subscribe and share your ideas and charts with the community!
--------------------------------------------------------------------------------------------------------
👑Best Signals (Forex/Crypto+70% accuracy) & Account Management (+20% profit/month on 10k accounts)
💰Free Channel t.me/tradingshotglobal
🤵Contact info@tradingshot.com t.me/tradingshot
🔥New service: next X100 crypto GEMS!
💰Free Channel t.me/tradingshotglobal
🤵Contact info@tradingshot.com t.me/tradingshot
🔥New service: next X100 crypto GEMS!
Disclaimer
The information and publications are not meant to be, and do not constitute, financial, investment, trading, or other types of advice or recommendations supplied or endorsed by TradingView. Read more in the Terms of Use.