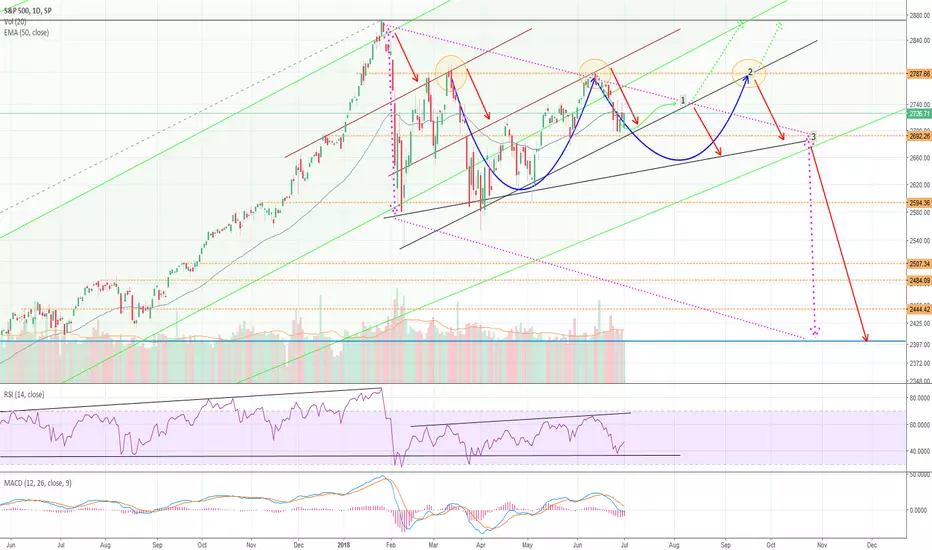
Since the last ATH in january (2848) the S&P 500 has fallen in steps (see trend lines).
The trend line at about 2.800 is a strong resistance. At this level the bears take over and the bulls flee out of the stocks.
And at about 2.700 or at least at 2.600 the game changes its direction.
Actually the index has just turned and is heading towards the 2.800 level.
On the way up we see different possibilities, coming from the TA and chart patterns.
1) S&P reaches the peak of the little triangle, gains momentum and rockets to the old ATH
If there is not enough momentum the bears take over and the index drops to the lower limit of the triangle
2) S&P takes a longer run and reaches the 2.800 - swing trend line; bears take over and the course falls into the bigger triangle
3) If 2 has taken part and S&P rebounds on the lower limit of the triangle (or on the lower limit of the trend channel), then it´ll reach the peak of the bigger triangle. Compared with the correction in february (the opening of the triangle) the correction could lead to the fib retracement 78,6% (2.400)
Note
Note
The index has shown surprisingly more strength than I´ve expected. But this doesn´t mean that my analysis is false - not at this moment. Because the index can fall back again - as happened in the past.
RSI has already turned!
S&P 500 is well above the EMA 50 - a correction very possible.
This analyis stays valid until the index will have broken the resistance line (brown).
No trading advice, but I wouldn´t invest now.
Note
Note
Another view on the S&P 500 shows that it is within an ascending triangle (wedge). The upper line is the swing trend line - a strong resistance which has been tested twice.The index is approaching the peak of this wedge. With enough momentum it could break up. But there is also the risk that it crosses the lower limit and falls to the lower limit of the long trend channel.
RSI has turned and is heading to neutral zone, MACD has triggered the signal line to the top. No clear signals coming from here.
Note
Trade active
The index has broken the upper limit of the wedge - but one should be aware of a false breakout: it could be a bull-trap.Why?
The RSI has declined while the index has marked higher prices - this makes a negative divergence.
Possibly the S&P 500 will turn in the next days, re-entering the triangle and the fall to the bottom.
As long as we see the negative divergence the risk for a correction is high.
Disclaimer
The information and publications are not meant to be, and do not constitute, financial, investment, trading, or other types of advice or recommendations supplied or endorsed by TradingView. Read more in the Terms of Use.
Disclaimer
The information and publications are not meant to be, and do not constitute, financial, investment, trading, or other types of advice or recommendations supplied or endorsed by TradingView. Read more in the Terms of Use.