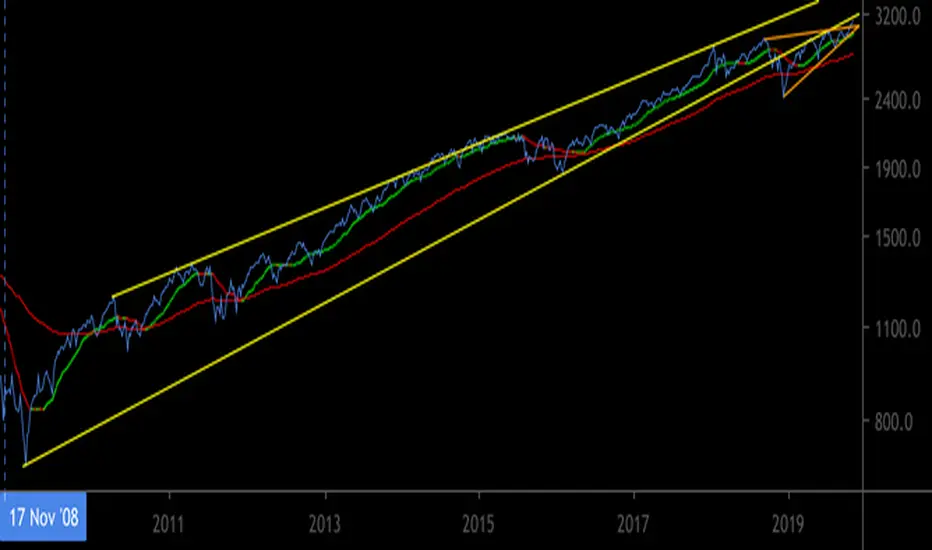
Trade based on your risk tolerance. Dotted vertical line indicates market cycle’s start through comparison to market cycle psychology chart.
- Short: Price has broken below yellow ascending wedge and confirmed former support as resistance with 3 rejections by bottom trend line.
- Long/Neutral: Price has seemingly broken above orange ascending wedge but has yet to test top trend line as support.
Note
Possible that the orange ascending wedge should instead look like thisDisclaimer
The information and publications are not meant to be, and do not constitute, financial, investment, trading, or other types of advice or recommendations supplied or endorsed by TradingView. Read more in the Terms of Use.
Disclaimer
The information and publications are not meant to be, and do not constitute, financial, investment, trading, or other types of advice or recommendations supplied or endorsed by TradingView. Read more in the Terms of Use.