Last post: Nov 20th 2018. See chart.
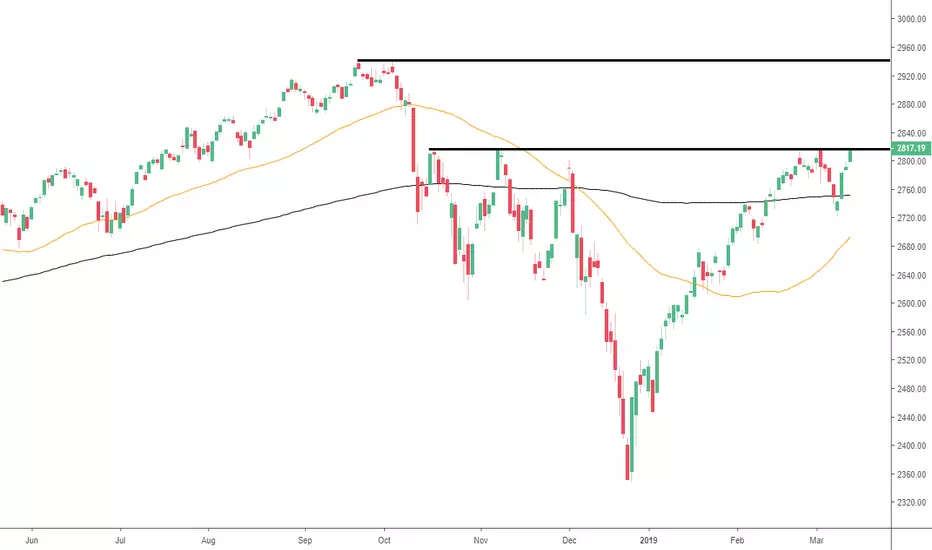
Review: Price was heading down and moved below the weekly 50 simple moving average.
Update: The market has reversed since then and is now back above the 50 simple moving average and trying to break the current resistance level.
Conclusion: We need to see if price can break the resistance level and continue to move higher and eventually break the previous all-time high.
Any comments or questions, do not hesitate to leave them below. Give us the thumbs up if you share our sentiments!
Sublime Trading
Join Our Private Community
bit.ly/join-ST-community
Plus Get Our Ultimate Stock Market Blueprint.
bit.ly/join-ST-community
Plus Get Our Ultimate Stock Market Blueprint.
Disclaimer
The information and publications are not meant to be, and do not constitute, financial, investment, trading, or other types of advice or recommendations supplied or endorsed by TradingView. Read more in the Terms of Use.