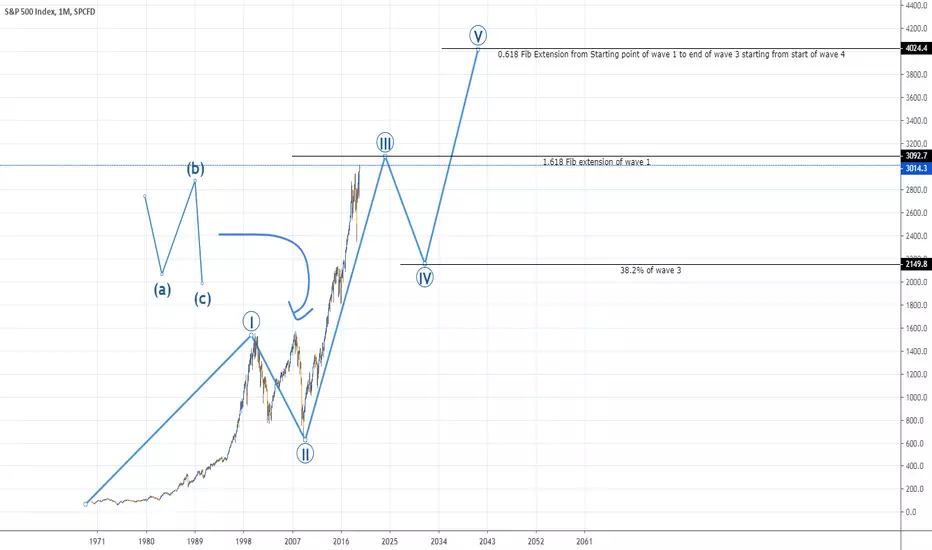
In grand supercycle I see wave 1 and 2 and three and i have shown the potential targets for future. it does not matter that these forecasts will play out or not but we can see that we are at wave three and i am goin to dive into details in this idea. by the way this mounthly chart of spx since 1970.
Note
This is the wave 2 of wave 3 of Grand super cycle.this is a 3-3-3-3-3 inverted triangle and further confirms that this is a correction
Note
A bigger picture of this triangleNote
So in wave 3 of supercycle we have an extension of wave 3 in wave 2 of 3 of supercycle we have a running flat ( a 3-3-5 may be)
Note
this is the primary degree details of wave 5 of cycle degree of wave 3 of supercycle degree, this is the end of wave 3 of wave 3 of grand super cyclewe have a expanded flat in wave 2 and a triangle in wave 4
Note
bigger picture of what we have done until nowNote
In wave 4 of supercycle degree of wave 3 of Grand supercycle degree we have a WXY correctionit is devided by 3-3-3 sub waves
wave w is a zig zag in which wave 2 of it is a expanded flat(3-3-5)
wave x is a simple zig zag
and wave y is zig zag too. but we can see a impulse wave in the C wave of Y wave and it is interesting because the quantity of this impulse wave is like a extended C wave. i do not know whether it is possible or not but i think it was a little bear market. i mean wave C should have sub wave count of 5 but not this big. any how, i think it is a valid count. any criticism is welcomed
Note
the bigger picture until nowNote
Here we have wave 5 of wave 3 of grand supercycle degreewave 2 retraced to 38.2% of wave 1
wave 5 went as 38.2% as size of start of wave 1 to end of wave 3 at 2936 level
wave 4 retraced to 38.2% of wave 3
wave 2 is a WXY correction and in its X wave we have a expanded flat
wave 4 is a Regular flat
wave 5 is a ending diagonal triangle
Note
the big picture of wave 3 of grand supercycleNote
wave 5 of 3 of grand supercycle almost ended at 78.6% size of wave 1 to end of 3 as i drew. it further confirms my count validationNote
may be what we dealing with in wave 4 of grand supercycle is a inverted triangle.why i say that?
because we didn't actually break the black trend line. if we break this line significantly to the upside we could say that wave 5 is started but right now it is more like a triangle
Note
i think it would be a expanded flat. as you cab see SPX loves to make expanded flats! i can't see the impulse wave initiation. it is more like a correction.Lets see what will happen.
Please like and share
Disclaimer
The information and publications are not meant to be, and do not constitute, financial, investment, trading, or other types of advice or recommendations supplied or endorsed by TradingView. Read more in the Terms of Use.
Disclaimer
The information and publications are not meant to be, and do not constitute, financial, investment, trading, or other types of advice or recommendations supplied or endorsed by TradingView. Read more in the Terms of Use.