the head and shoulders formation occurs when a market trend is in the process of reversal either from a bullish or bearish trend
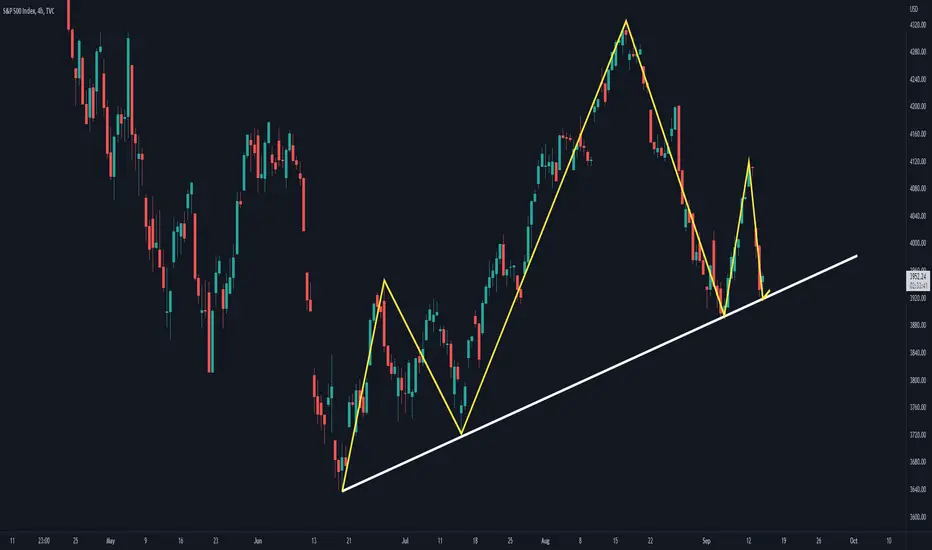
It is a specific chart formation that predicts a bullish-to-bearish trend reversal. The pattern appears as a baseline with three peaks, where the outside two are close in height, and the middle is highest.
white trend line is neck line
It is a specific chart formation that predicts a bullish-to-bearish trend reversal. The pattern appears as a baseline with three peaks, where the outside two are close in height, and the middle is highest.
white trend line is neck line
Note
Disclaimer
The information and publications are not meant to be, and do not constitute, financial, investment, trading, or other types of advice or recommendations supplied or endorsed by TradingView. Read more in the Terms of Use.
Disclaimer
The information and publications are not meant to be, and do not constitute, financial, investment, trading, or other types of advice or recommendations supplied or endorsed by TradingView. Read more in the Terms of Use.