If you haven`t seen my last chart:
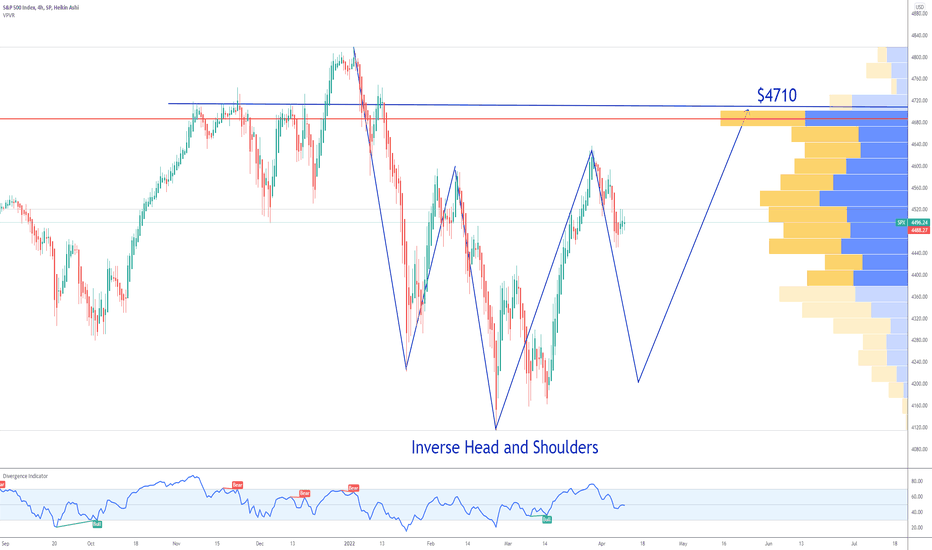
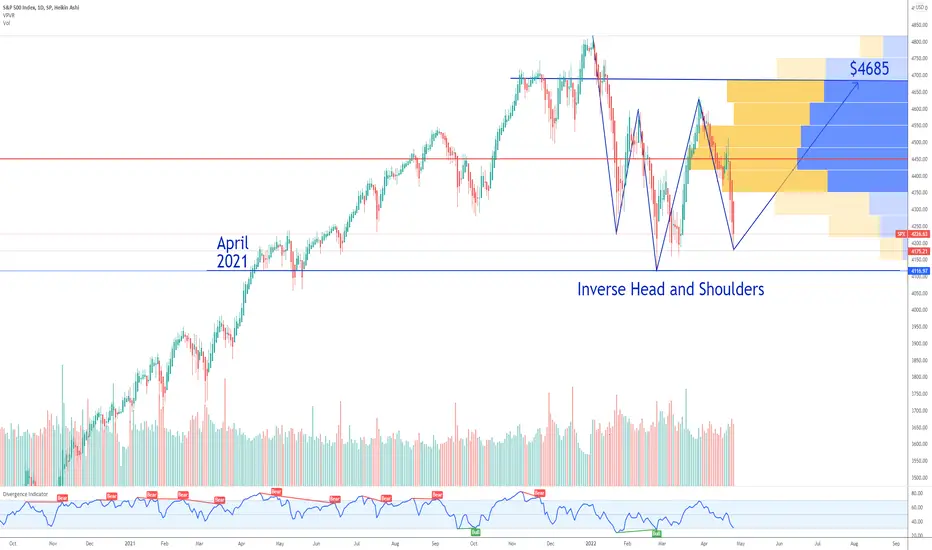
Then you should know that the inverse head and shoulders is a bullish chart pattern that can revers to the $4685 level by the end of the summer.
Looking forward to read your opinion about it.
Then you should know that the inverse head and shoulders is a bullish chart pattern that can revers to the $4685 level by the end of the summer.
Looking forward to read your opinion about it.
Private SIGNALS patreon.com/PremiumOptionsSignals
Trading COURSE bit.ly/tradex
RESULTS bit.ly/TG10x
TradeNation bit.ly/t10X
CRYPTO partner.bybit.com/b/37880
BUY-SELL INDICATORS tradingindicators.store/
Trading COURSE bit.ly/tradex
RESULTS bit.ly/TG10x
TradeNation bit.ly/t10X
CRYPTO partner.bybit.com/b/37880
BUY-SELL INDICATORS tradingindicators.store/
Disclaimer
The information and publications are not meant to be, and do not constitute, financial, investment, trading, or other types of advice or recommendations supplied or endorsed by TradingView. Read more in the Terms of Use.