Hi,
Bank of America, Merrill Lynch: "Stocks are going nowhere for the rest of the year."
There are some possibilities that it can be true but still, the chances are pretty high that Lynch has made a false statement.
BULLISH
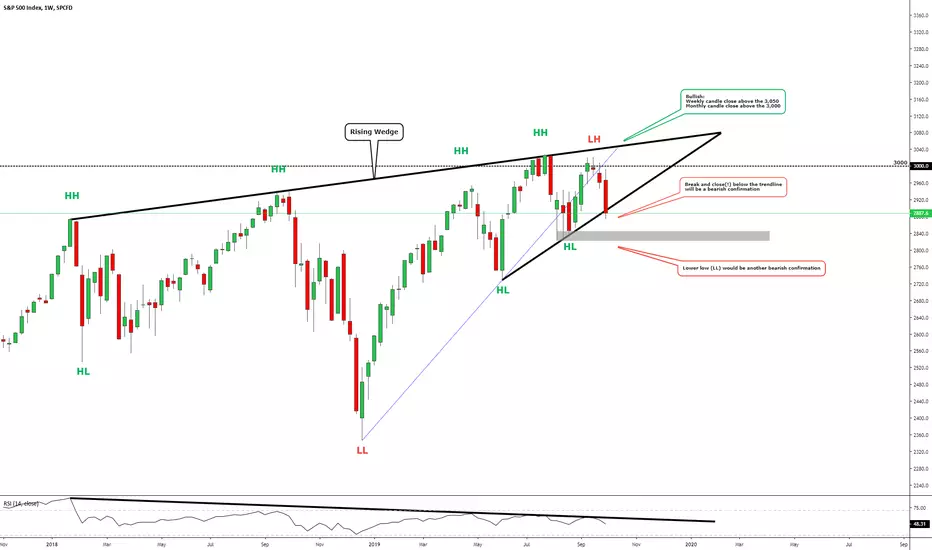
Firstly, let's talk through the bullish scenario and actually it is pretty simple. A Weekly, Monthly would be better, candle close above the recent ATH (all-time high):

Then the price has finally cracked the 3,000, then the price has made a new ATH and most importantly, it has made a breakout from the chart pattern called Inverted Head & Shoulders. Yes, it is a reversal pattern but at the moment, we can consider it as a slight confirmation for continuation move upwards because of the neckline, it is also considered as a strong minor trendline which is worked three times as a resistance.
It sounds easy but it isn't. Firstly, the selling pressure is pretty high and it needs to get a bounce upwards from the current levels, let's say 2,860 - 2,890.
There are some criteria were to rely on:

1. Daily EMA200 should act as a support level. It held perfectly in July/August.
2. The short-term trendline works as support.
3. Previously worked resistance level becomes support.
4. Weekly EMA50
5. Bullish candlestick pattern from the Monthly is still valid (3-4 months ago, bullish Railway Tracks)
As you see, nothing significant but miracles will happen, so let's wait and see. Today's candle close will be pretty crucial.
BEARISH
"S&P500 - the worst start to a quarter since the 2008 financial crisis as recession fears accelerate"
"S&P 500 Could Drop to 2,100 in the First Quarter"
Headlines = bearish
Price action = bearish
Patterns = bearish
ISM Manufacturing PMI = bearish
Bearish signs:
1. Three Monthly candles (July, August, September) have tried to break above the 3,000 - without success.
2. September high (previous high) is lower than ATH. So, a new lower high - another bearish sign.
3. Break below the dotted black trendline. Pulled from 24th of December 2018. Break below of the trendline will give the third sign that the upward trend from the end of 2018 may become an end.
4. Bearish chart pattern Rising Wedge. This dotted trendline was also a part of the bearish chart pattern, so, we have made already a breakout from there, plus the price is on the edge with the current trendline. Does it hold the price or not!? It doesn't look good at all.
5. RSI Divergence between the higher highs and RSI indicator
6. Bearish gap island
7. Too big differents between S&P500 and ISM Manufacturing (usually they move pretty equally).
Bearish signs and breakouts are pretty strong. Definitely, the financial crisis title is too much but still, you should be cautious. If the Daily candle gets a close below the 2,850 then Merrill Lynch has made a wrong statement - stocks will get a hit as well.
If it was helpful then take a second and support my effort by hitting the "LIKE" button, it is my only fee from You!
Best regards,
Vaido
Bank of America, Merrill Lynch: "Stocks are going nowhere for the rest of the year."
There are some possibilities that it can be true but still, the chances are pretty high that Lynch has made a false statement.
BULLISH
Firstly, let's talk through the bullish scenario and actually it is pretty simple. A Weekly, Monthly would be better, candle close above the recent ATH (all-time high):
Then the price has finally cracked the 3,000, then the price has made a new ATH and most importantly, it has made a breakout from the chart pattern called Inverted Head & Shoulders. Yes, it is a reversal pattern but at the moment, we can consider it as a slight confirmation for continuation move upwards because of the neckline, it is also considered as a strong minor trendline which is worked three times as a resistance.
It sounds easy but it isn't. Firstly, the selling pressure is pretty high and it needs to get a bounce upwards from the current levels, let's say 2,860 - 2,890.
There are some criteria were to rely on:
1. Daily EMA200 should act as a support level. It held perfectly in July/August.
2. The short-term trendline works as support.
3. Previously worked resistance level becomes support.
4. Weekly EMA50
5. Bullish candlestick pattern from the Monthly is still valid (3-4 months ago, bullish Railway Tracks)
As you see, nothing significant but miracles will happen, so let's wait and see. Today's candle close will be pretty crucial.
BEARISH
"S&P500 - the worst start to a quarter since the 2008 financial crisis as recession fears accelerate"
"S&P 500 Could Drop to 2,100 in the First Quarter"
Headlines = bearish
Price action = bearish
Patterns = bearish
ISM Manufacturing PMI = bearish
Bearish signs:
1. Three Monthly candles (July, August, September) have tried to break above the 3,000 - without success.
2. September high (previous high) is lower than ATH. So, a new lower high - another bearish sign.
3. Break below the dotted black trendline. Pulled from 24th of December 2018. Break below of the trendline will give the third sign that the upward trend from the end of 2018 may become an end.
4. Bearish chart pattern Rising Wedge. This dotted trendline was also a part of the bearish chart pattern, so, we have made already a breakout from there, plus the price is on the edge with the current trendline. Does it hold the price or not!? It doesn't look good at all.
5. RSI Divergence between the higher highs and RSI indicator
6. Bearish gap island
7. Too big differents between S&P500 and ISM Manufacturing (usually they move pretty equally).
Bearish signs and breakouts are pretty strong. Definitely, the financial crisis title is too much but still, you should be cautious. If the Daily candle gets a close below the 2,850 then Merrill Lynch has made a wrong statement - stocks will get a hit as well.
If it was helpful then take a second and support my effort by hitting the "LIKE" button, it is my only fee from You!
Best regards,
Vaido
Note
"...it needs to get a bounce upwards from the current levels, let's say 2,860 - 2,890."It got a bounce from the mentioned levels, the trendline and EMA's held it pretty nicely, even after another negative news around the manufacturing sector.
The crucial day has ended nicely but still, be cautious!
Disclaimer
The information and publications are not meant to be, and do not constitute, financial, investment, trading, or other types of advice or recommendations supplied or endorsed by TradingView. Read more in the Terms of Use.
Disclaimer
The information and publications are not meant to be, and do not constitute, financial, investment, trading, or other types of advice or recommendations supplied or endorsed by TradingView. Read more in the Terms of Use.