Hello everyone , as we all know the market action discounts everything :)
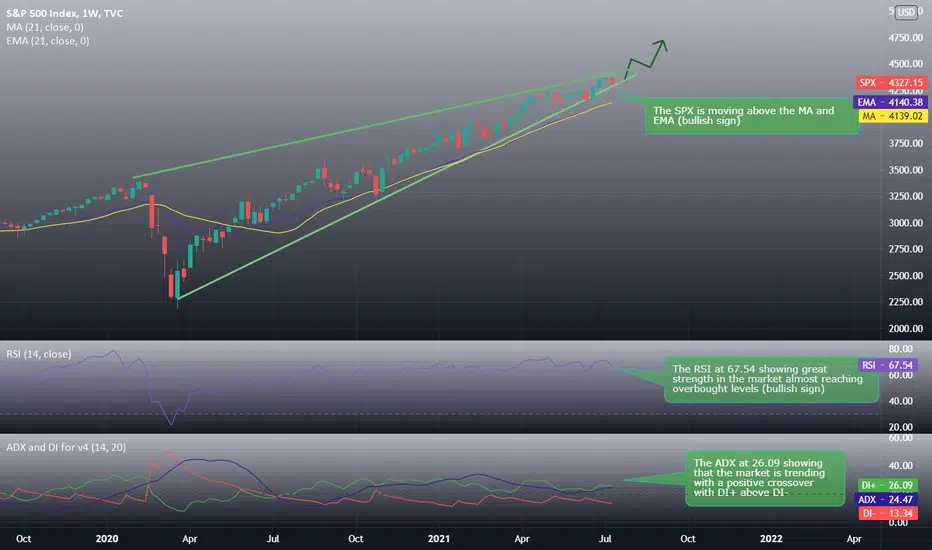
The SPX keeps going on as the Index price moved from 4147.36 to the range of 4371.08 in the last month alone almost a 5.4% increase in 30 days , the price seems to be moving in an rising wedge with no breaking of the trend line, the bulls trying not to lose control to the bears and they hope to keep working to keep this uptrend going and so far it looks like its still on the move.
Using different indicators confirm this movement where we see that :
1_The SPX is at 4327.15 moving above the MA at 4139.02 and EMA at4140.38 (bullish sign)
2_The RSI is at 67.54 showing great strength in the market almost reaching overbought levels, no divergences between the RSI and the market price (bullish sign)
3_The ADX at 26.09 showing that the market is trending with a positive crossover with DI+ at 26.09 above DI- 13.34
Support & Resistance points :
support Resistance
1_ 4315.42 1_4397.65
2_ 4261.28 2_4425.74
3_ 4233.19 3_4479.88
Fundamental point of view :
The prior week saw a bit of excitement around the S&P 500, with the index pulling back on Thursday to trendline support. But the move on the Friday following that sell-off was a pronounced bullish engulfing candlestick that propelled price action to another trendline, helping to mark resistance on a rising wedge pattern.
That bullish engulfing candlestick led into another move of strength on Monday, with prices setting that fresh all-time-high, with another showing up in US markets on Tuesday a few hours after that 5.4% CPI print.
While rising wedge formations will often be approached with the aim of bearish reversals, given the length and force of the move, there’s not yet a bearish trigger nearby. For that scenario to begin to set up, traders would likely want to look for a test below near-term support around 4280, followed by a test of longer-term support around 4127. That could begin to set a reversal framework into motion.
_____________________________Make sure to Follow and Like for more content_____________________________
This is my personal opinion done with technical analysis of the market price and research online from fundamental analysts for The Fundamental point of view , not financial advice.
If you have any questions please ask and have a great day !!
Thank you for reading.
Disclaimer
The information and publications are not meant to be, and do not constitute, financial, investment, trading, or other types of advice or recommendations supplied or endorsed by TradingView. Read more in the Terms of Use.
Disclaimer
The information and publications are not meant to be, and do not constitute, financial, investment, trading, or other types of advice or recommendations supplied or endorsed by TradingView. Read more in the Terms of Use.
