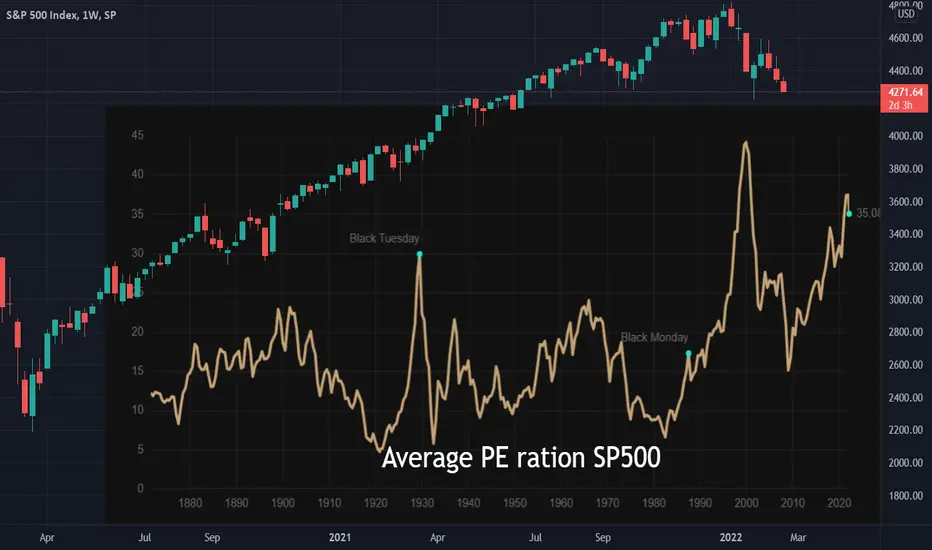
PE, aka price-to-earnings ratio is basic gauge of how much investors are willing to pay in relation to earnings potential
Note
To clarify: the Average PE Ratio chart runs through 1880 to 2022.Disclaimer
The information and publications are not meant to be, and do not constitute, financial, investment, trading, or other types of advice or recommendations supplied or endorsed by TradingView. Read more in the Terms of Use.
Disclaimer
The information and publications are not meant to be, and do not constitute, financial, investment, trading, or other types of advice or recommendations supplied or endorsed by TradingView. Read more in the Terms of Use.