Here's my modest attempt to identify S&P 500 Supercycles.
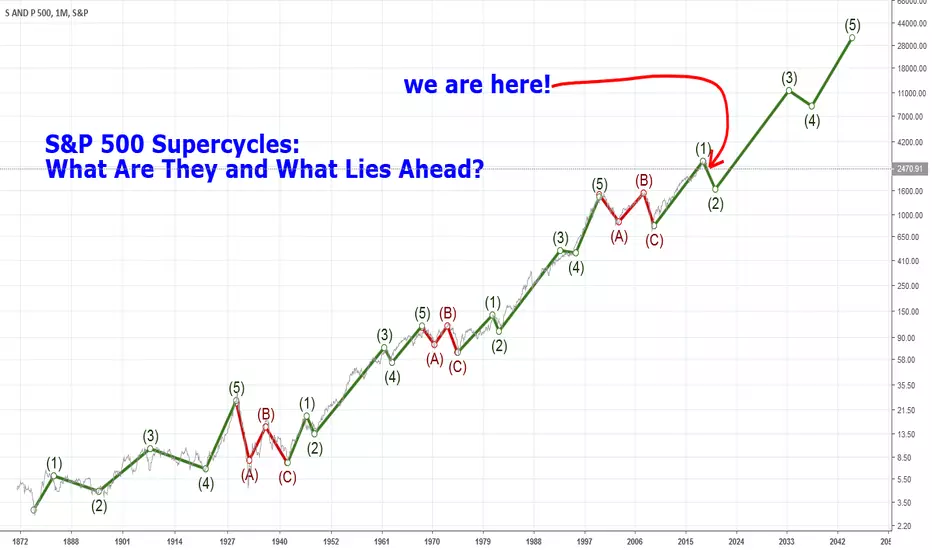
The chart shows the S&P 500 (monthly bars) since 1872 on a log scale.
Maybe it is not as bad as they say, and we are currently "just" in the Supercycle Wave 2.
Before us would be the longest Wave 3. Hopefully that's true. I can dream, can't I? ;-)
The chart shows the S&P 500 (monthly bars) since 1872 on a log scale.
Maybe it is not as bad as they say, and we are currently "just" in the Supercycle Wave 2.
Before us would be the longest Wave 3. Hopefully that's true. I can dream, can't I? ;-)
Note
That's what I currently see hapenning on a bigger scale:Note
Update 14-Jun-2019: From today's perspective, I could imagine S&P doing its major correction cycle (Wave 2) like thisDisclaimer
The information and publications are not meant to be, and do not constitute, financial, investment, trading, or other types of advice or recommendations supplied or endorsed by TradingView. Read more in the Terms of Use.
Disclaimer
The information and publications are not meant to be, and do not constitute, financial, investment, trading, or other types of advice or recommendations supplied or endorsed by TradingView. Read more in the Terms of Use.