After my last BAD trade prediction, I just laid low for a little while, was very sick and visited some relatives for a little while. But I am jumping back on the horse, as they say.
I anticipate the market to go down this Thursday when jobless claims are reported.
I expect for whatever the news for it to be negative or not as good as expected.
I am using the Heikin Ashi candlesticks.
1) They show more of a directional movement within candlesticks.
2) They tend to filter out the market noise so you can see the market direction better.
3) It reduces false signals, allowing you to stay in the trade longer.
4) And, it also gives you a smoother appearance making it easier to see trends and reversals.
But I often switch between regular candlesticks as those are the candlesticks I started trading with and I still do get a little bit of information from the regular candlesticks.
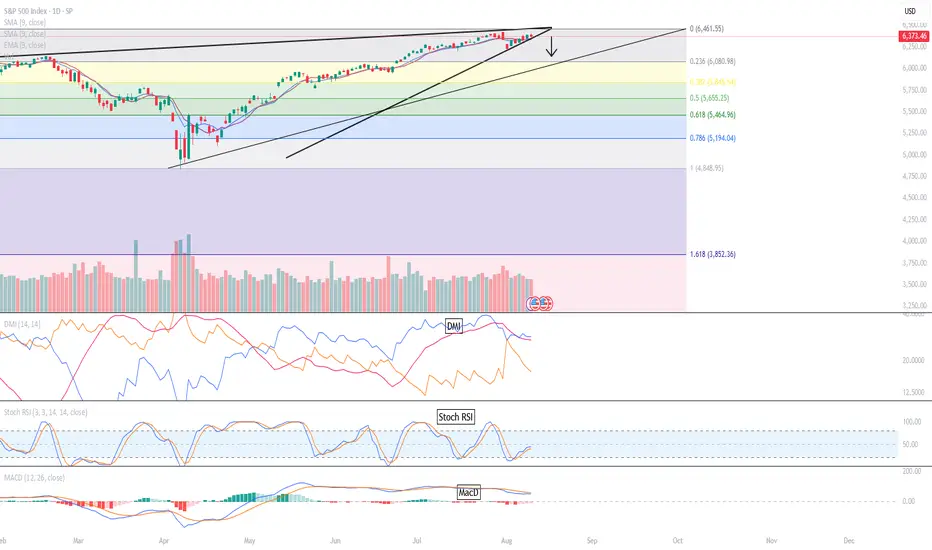
I think we had an ascending triangle forming on the S&P with the tip forming on Friday, August 15th.
Usually, the chart can exit 2/3 before the tip. So it can start exiting the triangle before now and August 15, 2025 usually with some fundamental trigger. I suspect the trigger would be the jobless claims report on Thursday, August 14, 2025.
It can either exit up or down at the tip but I suspected that the market will exit down given the weekly indicators are suggesting a move down.
I am undecided on the targets as of yet. For some reason I think it will be a shallow move due to the slop of the weekly Stoch RSI.
STOPS:
1) the low of the previous Heikin Ashi candlestick,
2) 2 red Heikin Ashi candlesticks,
3) a specific dollar amount for a total loss for my trade or
4) a specific dollar amount per contract.
**If it hits one of those stops, I am out of my trade.
My trading plan only entails me to use 10% of my total account. If I am wrong on this trade, I will not implode my account.
Trade at your own risk, make sure you have stops in place, a trading plan and only use 10% or less of your account.
Happy Trading Everyone!
I anticipate the market to go down this Thursday when jobless claims are reported.
I expect for whatever the news for it to be negative or not as good as expected.
I am using the Heikin Ashi candlesticks.
1) They show more of a directional movement within candlesticks.
2) They tend to filter out the market noise so you can see the market direction better.
3) It reduces false signals, allowing you to stay in the trade longer.
4) And, it also gives you a smoother appearance making it easier to see trends and reversals.
But I often switch between regular candlesticks as those are the candlesticks I started trading with and I still do get a little bit of information from the regular candlesticks.
I think we had an ascending triangle forming on the S&P with the tip forming on Friday, August 15th.
Usually, the chart can exit 2/3 before the tip. So it can start exiting the triangle before now and August 15, 2025 usually with some fundamental trigger. I suspect the trigger would be the jobless claims report on Thursday, August 14, 2025.
It can either exit up or down at the tip but I suspected that the market will exit down given the weekly indicators are suggesting a move down.
I am undecided on the targets as of yet. For some reason I think it will be a shallow move due to the slop of the weekly Stoch RSI.
STOPS:
1) the low of the previous Heikin Ashi candlestick,
2) 2 red Heikin Ashi candlesticks,
3) a specific dollar amount for a total loss for my trade or
4) a specific dollar amount per contract.
**If it hits one of those stops, I am out of my trade.
My trading plan only entails me to use 10% of my total account. If I am wrong on this trade, I will not implode my account.
Trade at your own risk, make sure you have stops in place, a trading plan and only use 10% or less of your account.
Happy Trading Everyone!
Trade active
I think this is WRONG! The daily indicators look too bullish. I think there is still a chance that this will still break up out of the triangle instead of down. Therefor I am going to close this trade and redraw it. I am also going to try to draw a new chart with ATD. But first ... coffee. LOL!Trade closed manually
I think this is WRONG! The daily indicators look too bullish. I think there is still a chance that this will still break up out of the triangle instead of down. Therefor I am going to close this trade and redraw it. I am also going to try to draw a new chart with ATD. But first ... coffee. LOL!Disclaimer
The information and publications are not meant to be, and do not constitute, financial, investment, trading, or other types of advice or recommendations supplied or endorsed by TradingView. Read more in the Terms of Use.
Disclaimer
The information and publications are not meant to be, and do not constitute, financial, investment, trading, or other types of advice or recommendations supplied or endorsed by TradingView. Read more in the Terms of Use.