Technical Analysis and Outlook:
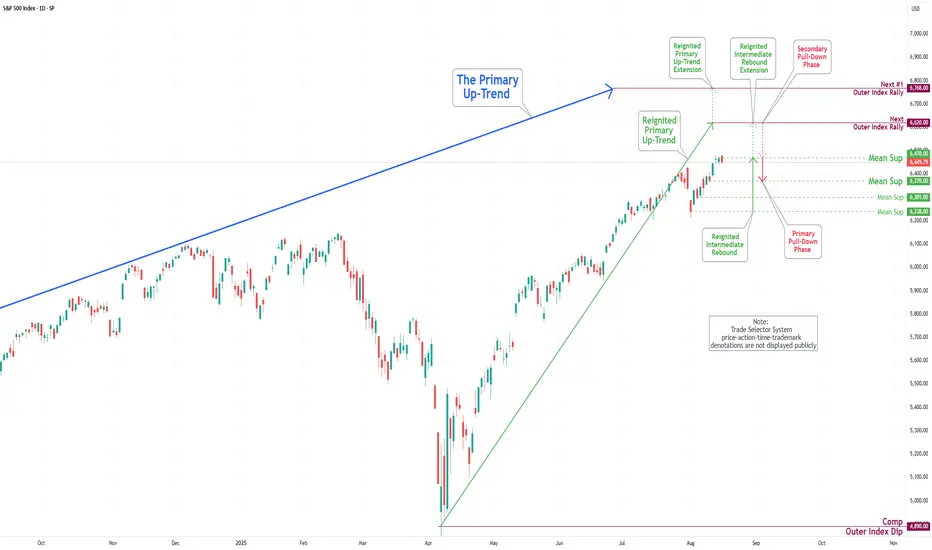
During the trading activity of the previous week, the S&P 500 Index exhibited a predominantly robust bullish trend, achieving a noteworthy marker by retesting the completed Outer Index Rally target of 6420, as outlined in last week’s Daily Chart Analysis. The primary objective now is to target the subsequent level, labeled the Outer Index Rally target, of 6620. On the downside, it is crucial to recognize that the current price movement is prone to retreat to Mean Support 6370 before the upward trajectory resumes.
During the trading activity of the previous week, the S&P 500 Index exhibited a predominantly robust bullish trend, achieving a noteworthy marker by retesting the completed Outer Index Rally target of 6420, as outlined in last week’s Daily Chart Analysis. The primary objective now is to target the subsequent level, labeled the Outer Index Rally target, of 6620. On the downside, it is crucial to recognize that the current price movement is prone to retreat to Mean Support 6370 before the upward trajectory resumes.
Related publications
Disclaimer
The information and publications are not meant to be, and do not constitute, financial, investment, trading, or other types of advice or recommendations supplied or endorsed by TradingView. Read more in the Terms of Use.
Related publications
Disclaimer
The information and publications are not meant to be, and do not constitute, financial, investment, trading, or other types of advice or recommendations supplied or endorsed by TradingView. Read more in the Terms of Use.
