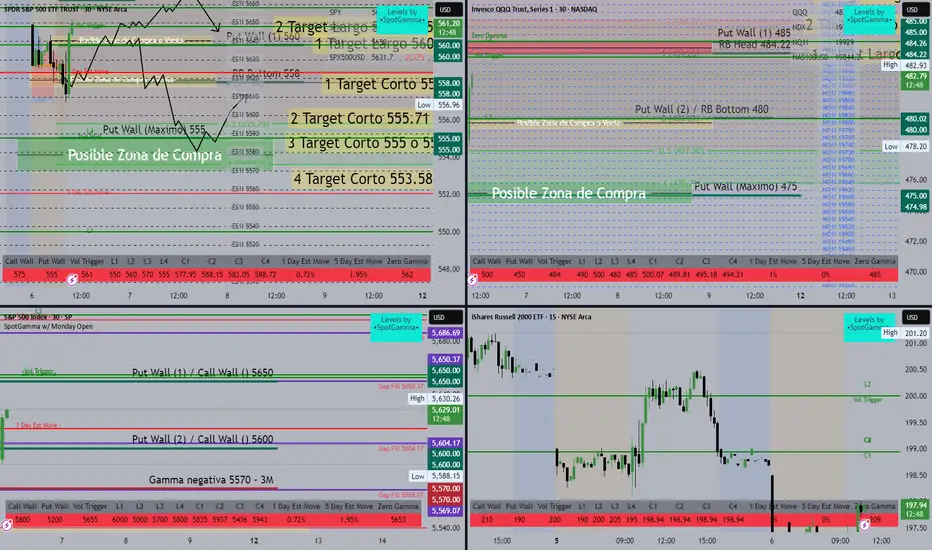
Overall Market Context:
This image shows a multi-index SpotGamma-style Liquidity Map for:
SPY/SPX (top-left)
QQQ/NQ (top-right)
SPX Futures (bottom-left)
IWM (Russell 2000, bottom-right)
Each panel displays Gamma levels, Call/Put Walls, Zero Gamma zones, and Volatility Triggers to interpret potential support/resistance zones and expected market behavior.
🔹 Top-Left (SPY / SPX500USD Liquidity Map)
Resistance Zone: Around 558–560 (multiple “Target Corto” or Short Targets noted).
Support Zone: 553.58–555.00 (green zone marked as "Possible Buying Zone").
Call Wall at 575, Put Wall at 555 — this tightens the range.
Vol Trigger: 561 — above this could imply strength.
📌 Implication: Strong overhead resistance from 558–560. Breakdown below 555 may open downside targets to 553.58. Support expected around 555. Zone 553.58 is the last strong line of defense.
Disclaimer
The information and publications are not meant to be, and do not constitute, financial, investment, trading, or other types of advice or recommendations supplied or endorsed by TradingView. Read more in the Terms of Use.
Disclaimer
The information and publications are not meant to be, and do not constitute, financial, investment, trading, or other types of advice or recommendations supplied or endorsed by TradingView. Read more in the Terms of Use.