Hi,
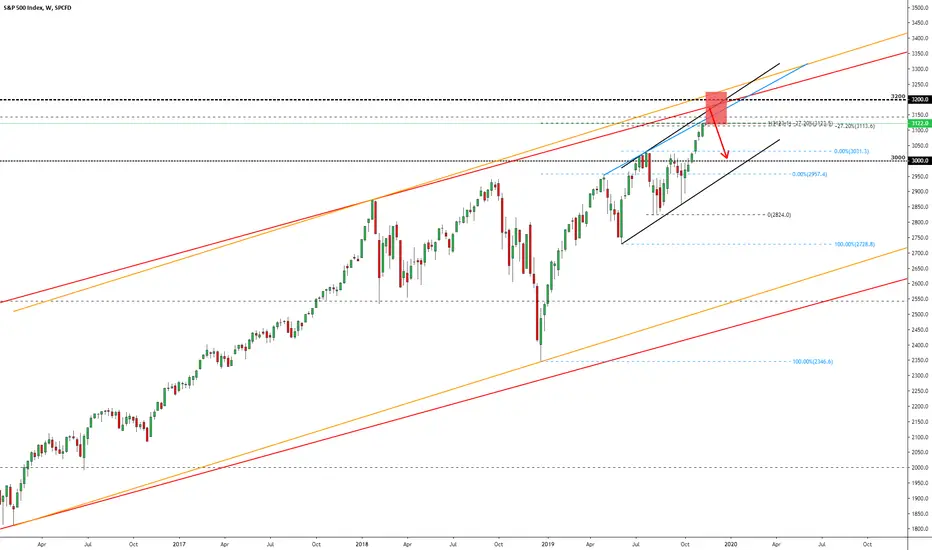
S&P 500 (SPX) has reached inside the area where it may make a correction after 6 continually bullish weeks.
Technically, I did everything I could to determine the area which can act as resistance (it is difficult if the asset makes all-time highs), it consists of:
1. 3x Channel projections. They all should work as resistance levels.
2. Minor trendline (light-blue)
3. Short-term AB=CD and actually at the moment, we are on the D point. So, do not be surprised if the correction starts from here (3120-3130)
4. 2-3x Fibonacci Extensions
5. The middle number 3200.
Basically, at the moment is this situation - if you can draw some logical lines from somewhere then they run through the marked red resistance box. The second considerable resistance box stays around 3400 but I think we will see a correction before we even reach there.
If the correction starts then probably it goes back to retest 3,000.
Please, take a second and support my effort by hitting the "LIKE" button, it is my only FEE from You!
Best regards,
Vaido
🔍I do the technicals - so You don’t have to.
📊Follow my research on Substack:
👉vaido.substack.com/ - ENG
👉vaidoveek.substack.com/ - EST
🚀 Actionable market analysis, ideas, and education
📊Follow my research on Substack:
👉vaido.substack.com/ - ENG
👉vaidoveek.substack.com/ - EST
🚀 Actionable market analysis, ideas, and education
Related publications
Disclaimer
The information and publications are not meant to be, and do not constitute, financial, investment, trading, or other types of advice or recommendations supplied or endorsed by TradingView. Read more in the Terms of Use.