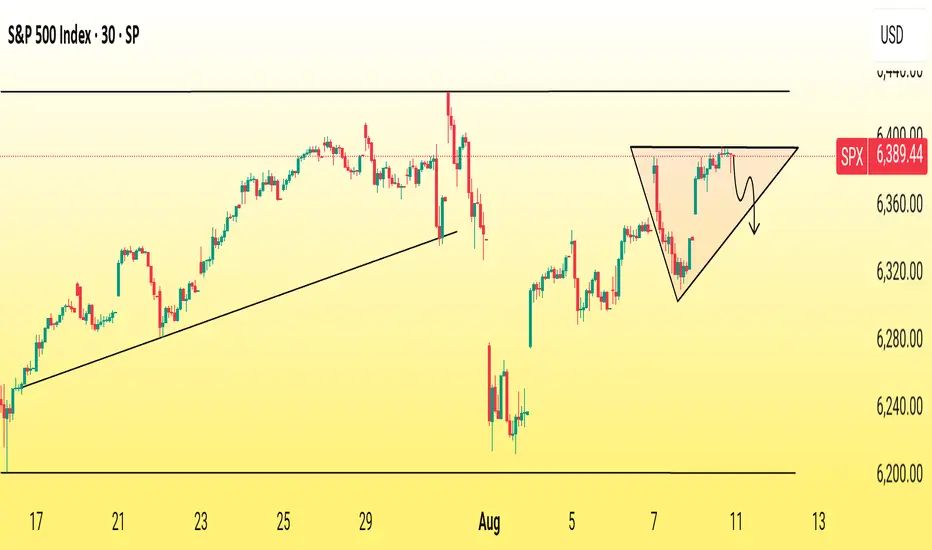
The S&P 500 Index (SPX) is forming a bearish pennant pattern on the 30-minute chart, suggesting possible continuation of the recent downtrend. Price action is consolidating within converging trendlines after a sharp drop, with a breakdown below support near 6,360 potentially opening the door to further declines toward the 6,300 level. Traders should watch for confirmation with increased selling volume.
Pattern Structure: Price has made a steep drop, then entered a short consolidation bounded by converging trendlines (lower highs and higher lows).
Bias: This setup often signals a continuation of the prior trend — in this case, downward.
Trigger Level: A decisive break below the pennant’s lower support (around 6,360) could confirm the bearish signal.
Target Zone: If the breakdown occurs, the measured move could aim toward the 6,300–6,280 range, matching the height of the prior drop.
Risk Factor: A false breakout is possible, especially if broader market sentiment shifts bullish suddenly.
In short: The chart suggests sellers remain in control, and the next move hinges on whether support at ~6,360 holds or breaks.
Trade active
Order cancelled
𝐃𝐨𝐧'𝐭 𝐁𝐮𝐲 𝐒𝐢𝐠𝐧𝐚𝐥𝐬💯
t.me/+hp9a1VuOmDg2NzI0
𝐅𝐫𝐞𝐞 𝐒𝐢𝐠𝐧𝐚𝐥𝐬 𝐟𝐨𝐫 𝐥𝐢𝐟𝐞𝐭𝐢𝐦𝐞
𝐆𝐎𝐋𝐃 ♠️
GBPUSD♠️
𝐁𝐓𝐂𝐔𝐒𝐃♠️
𝐎𝐭𝐡𝐞𝐫 𝐀𝐥𝐥 𝐏𝐚𝐢𝐫𝐬 𝐀𝐯𝐚𝐢𝐥𝐚𝐛𝐥𝐞
𝐉𝐨𝐢𝐧 𝐮𝐬 𝐨𝐧 𝐓𝐞𝐥𝐞𝐠𝐫𝐚𝐦
t.me/+hp9a1VuOmDg2NzI0
t.me/+hp9a1VuOmDg2NzI0
𝐅𝐫𝐞𝐞 𝐒𝐢𝐠𝐧𝐚𝐥𝐬 𝐟𝐨𝐫 𝐥𝐢𝐟𝐞𝐭𝐢𝐦𝐞
𝐆𝐎𝐋𝐃 ♠️
GBPUSD♠️
𝐁𝐓𝐂𝐔𝐒𝐃♠️
𝐎𝐭𝐡𝐞𝐫 𝐀𝐥𝐥 𝐏𝐚𝐢𝐫𝐬 𝐀𝐯𝐚𝐢𝐥𝐚𝐛𝐥𝐞
𝐉𝐨𝐢𝐧 𝐮𝐬 𝐨𝐧 𝐓𝐞𝐥𝐞𝐠𝐫𝐚𝐦
t.me/+hp9a1VuOmDg2NzI0
Related publications
Disclaimer
The information and publications are not meant to be, and do not constitute, financial, investment, trading, or other types of advice or recommendations supplied or endorsed by TradingView. Read more in the Terms of Use.