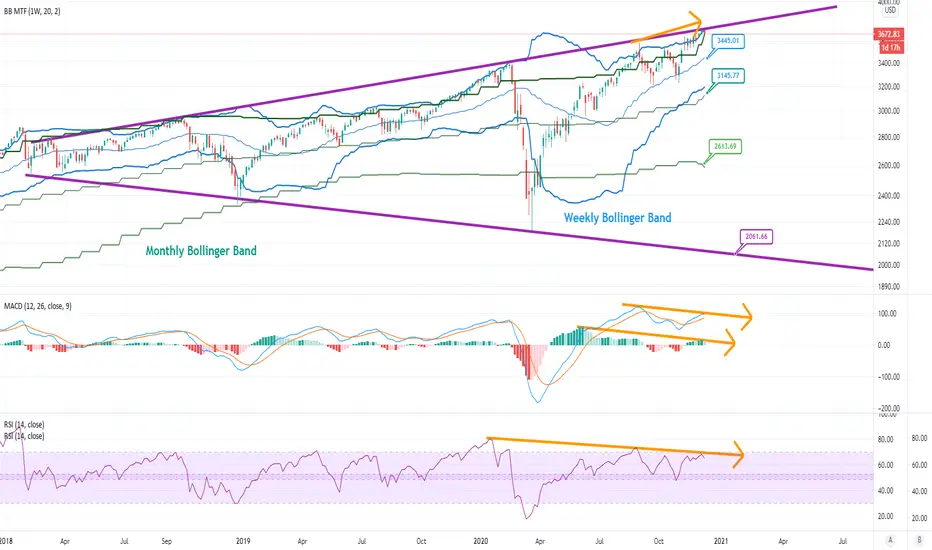
With screaming bearish divergence
I've zoomed into the 3d chart to help get the best picture of the divergence and price action, balancing the pros and cons of using either the 1D or 1W charts. The price action is clearly out of the green monthly bollinger band and a chart lower down in the post will show how much SPX doesn't like that condition. The purple line is the resistance for megaphone that a lot of people have been watching since the price action bottomed late March. The megaphone should tighten either into a diamond or some other pattern but lots of people have been blown out shorting or FOMOing in due to all the gains they see.
The MACD is showing bearish divergence on the MACD proper, but also the histogram. Not a great place to be
The RSI is also showing a lot of bearish divergence with the arrow shaft being used to show a clear resistance line on the RSI.
Target Setting
The chart below is a little cleaner to see the big picture so lets take gander. The most common reaction to the price being out of the monthly bollinger band is a return of price action to the weekly baseline. That is only some 6-7% away at this point which would be a very minor drop. I would expect the RSI would be bouncing in the shaded area I added which is between 49-53. I don't think we will see that.
A more realistic move would be to either the lower limit of the weely bollinger band or the baseline of the monthy bollinger band, which are roughly at the same place (just like they were in the March dump. A long term chart shows how the price action acts when it has popped out of the monthly bollinger band. This isn't crypto, we don't start a parabolic bull market when the price action finnal forces its way out of the monthly bollinger band.

With SPX at this long term resistance and in a position where it cold lose a lot of its value I am getting risk averse.
I've zoomed into the 3d chart to help get the best picture of the divergence and price action, balancing the pros and cons of using either the 1D or 1W charts. The price action is clearly out of the green monthly bollinger band and a chart lower down in the post will show how much SPX doesn't like that condition. The purple line is the resistance for megaphone that a lot of people have been watching since the price action bottomed late March. The megaphone should tighten either into a diamond or some other pattern but lots of people have been blown out shorting or FOMOing in due to all the gains they see.
The MACD is showing bearish divergence on the MACD proper, but also the histogram. Not a great place to be
The RSI is also showing a lot of bearish divergence with the arrow shaft being used to show a clear resistance line on the RSI.
Target Setting
The chart below is a little cleaner to see the big picture so lets take gander. The most common reaction to the price being out of the monthly bollinger band is a return of price action to the weekly baseline. That is only some 6-7% away at this point which would be a very minor drop. I would expect the RSI would be bouncing in the shaded area I added which is between 49-53. I don't think we will see that.
A more realistic move would be to either the lower limit of the weely bollinger band or the baseline of the monthy bollinger band, which are roughly at the same place (just like they were in the March dump. A long term chart shows how the price action acts when it has popped out of the monthly bollinger band. This isn't crypto, we don't start a parabolic bull market when the price action finnal forces its way out of the monthly bollinger band.
With SPX at this long term resistance and in a position where it cold lose a lot of its value I am getting risk averse.
And I promise every Floridian that you will all be rich... because we're gonna print some more money! Why didn't anybody ever think of this before?
~Nathan Explosion
~Nathan Explosion
Disclaimer
The information and publications are not meant to be, and do not constitute, financial, investment, trading, or other types of advice or recommendations supplied or endorsed by TradingView. Read more in the Terms of Use.
Disclaimer
The information and publications are not meant to be, and do not constitute, financial, investment, trading, or other types of advice or recommendations supplied or endorsed by TradingView. Read more in the Terms of Use.