A year ago the majority were bullish ‘don’t fight the fed’ ‘stoNKS oNlY gO Up’ and so on…
Here we are a year later-having gone full circle: on time, price and sentiment
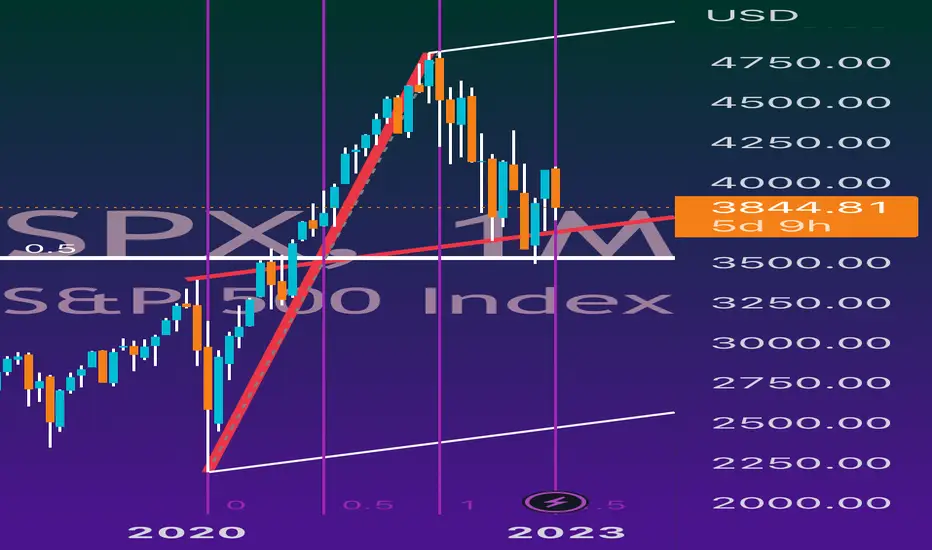
The above chart incorporates the trinity: Andrews, Gann and Fibonacci
I’m here to tell you the chart is bullish
We’ve retraced half of the range of the Corona move in half the time
There was a bullish reaction to the 50% level, and time has been squared with price throughout
Geometrically, the chart is balanced; as evidenced by the reaction to the key red median line
Moreover, geometry for the dollar shows a likely generational top
Let’s see what happens
CRAPPY NEW YEAR!!! (for bears)
GRI2023
NOT TARDING ADVICE
Here we are a year later-having gone full circle: on time, price and sentiment
The above chart incorporates the trinity: Andrews, Gann and Fibonacci
I’m here to tell you the chart is bullish
We’ve retraced half of the range of the Corona move in half the time
There was a bullish reaction to the 50% level, and time has been squared with price throughout
Geometrically, the chart is balanced; as evidenced by the reaction to the key red median line
Moreover, geometry for the dollar shows a likely generational top
Let’s see what happens
CRAPPY NEW YEAR!!! (for bears)
GRI2023
NOT TARDING ADVICE
Note
Lol probably the chart of the year and 0 likes.. why do I bother lololololRelated publications
Disclaimer
The information and publications are not meant to be, and do not constitute, financial, investment, trading, or other types of advice or recommendations supplied or endorsed by TradingView. Read more in the Terms of Use.
Related publications
Disclaimer
The information and publications are not meant to be, and do not constitute, financial, investment, trading, or other types of advice or recommendations supplied or endorsed by TradingView. Read more in the Terms of Use.