Based on the provided 4-hour chart of the S&P 500 Index (SPX500), here is a brief summary and outlook.
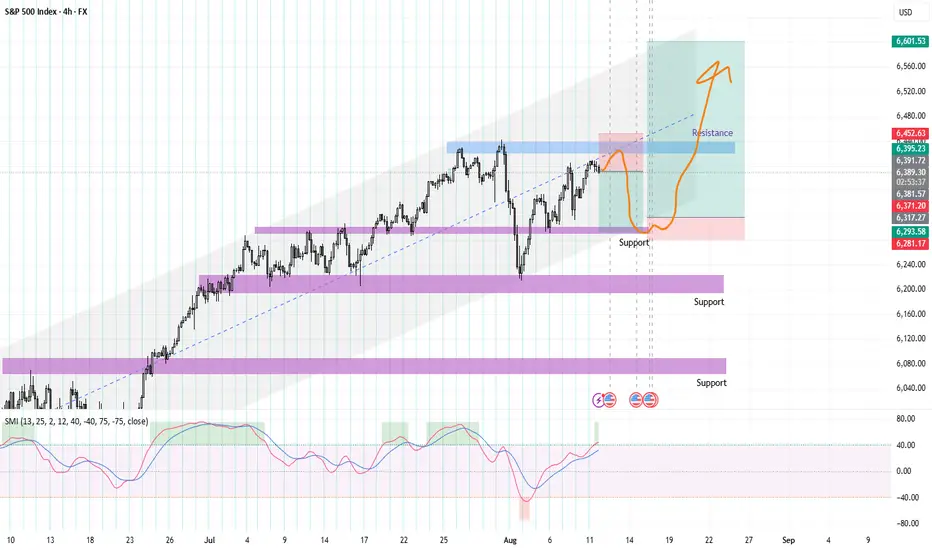
The SPX500 has been in a clear uptrend, as indicated by the trend channel and a series of higher highs and higher lows. The price is currently facing resistance near the 6,450 level, where a recent high was made before a pullback. The chart also highlights several key support zones, with the most immediate one being around the 6,290 level.
The chart illustrates a potential scenario where the price consolidates or pulls back from the current resistance. The orange arrow depicts a possible movement where the price could retrace towards the immediate support level around 6,290 before finding buyers. From this support, the expectation is for the uptrend to resume, with the price aiming to break through the resistance at 6,450. A successful breakout would open the path towards the upper boundary of the trend channel, with a target set around 6,600.
The key expectation is a continuation of the overall bullish trend after a potential short-term dip. Traders should look for the price to hold above the support at 6,290 for a long entry opportunity. A break below this support would be a bearish signal, but as long as the price stays within the trend channel, the overall bias remains bullish. The final target for this move is projected to be around the 6,600 level, which aligns with the trend channel's upper boundary.
Disclaimer
The information and publications are not meant to be, and do not constitute, financial, investment, trading, or other types of advice or recommendations supplied or endorsed by TradingView. Read more in the Terms of Use.
Disclaimer
The information and publications are not meant to be, and do not constitute, financial, investment, trading, or other types of advice or recommendations supplied or endorsed by TradingView. Read more in the Terms of Use.