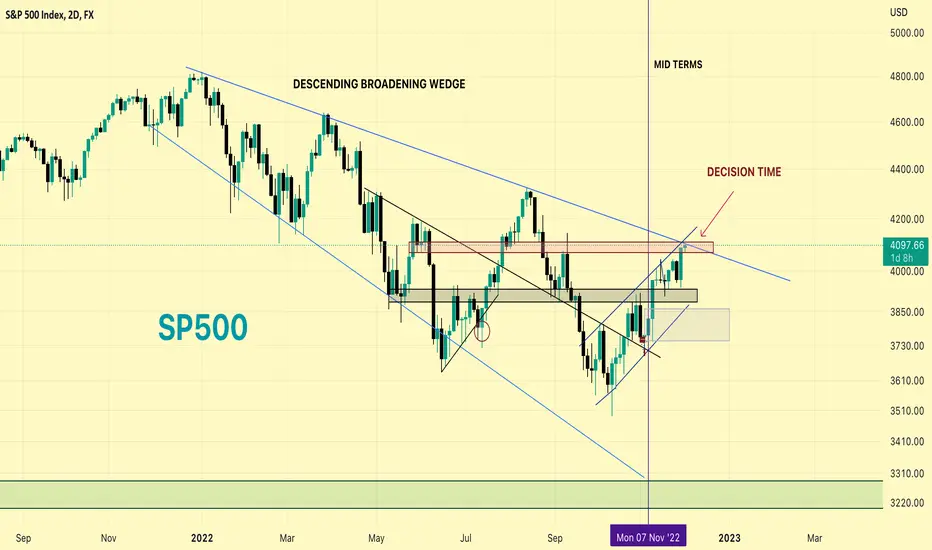
DECISION TIME.
The amount of resistance here is unreal. Must be a lot of stops right above $4200.
The chart looks bearish, but Inflation has Topped?..
Moment of Truth. Not the time to long, derisk or hold.
#SP500
Blue Trendline = Diagonal Resistance
Red Box = Resistance horizontal
Blue Trendline = Diagonal Resistance
Comment if you think we will break out / down.
Disclaimer
The information and publications are not meant to be, and do not constitute, financial, investment, trading, or other types of advice or recommendations supplied or endorsed by TradingView. Read more in the Terms of Use.
Disclaimer
The information and publications are not meant to be, and do not constitute, financial, investment, trading, or other types of advice or recommendations supplied or endorsed by TradingView. Read more in the Terms of Use.