We may be approaching a critical inflection point.
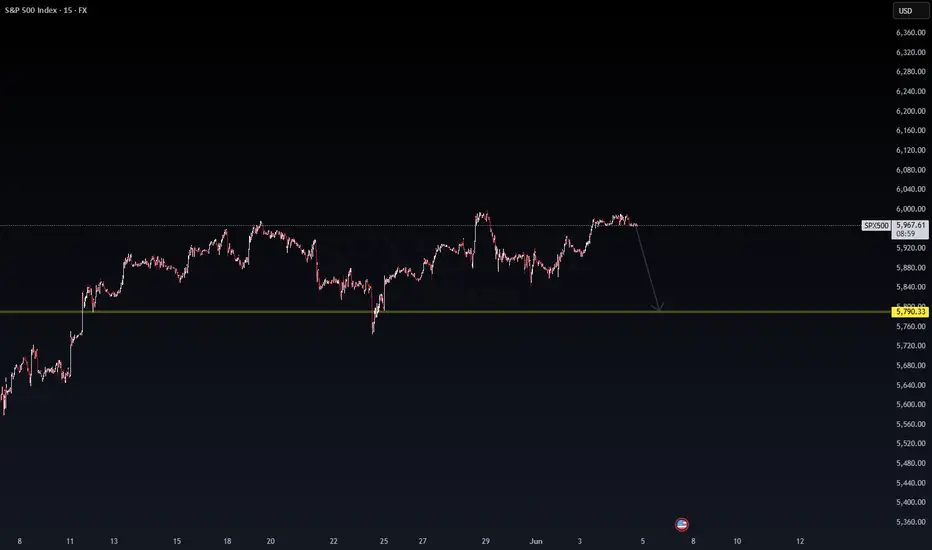
Price action is showing signs of exhaustion after multiple failed attempts to break higher. The market structure is compressing beneath resistance, setting the stage for a potential breakdown.
🧭 Key Level to Watch:
Support at 5,790.33 aligns with previous liquidity sweeps and demand zones. A move toward this level could reflect rotation from short-term bullish euphoria into a broader correction cycle.
⚠️ Institutional traders, are you watching the same tape?
This isn’t just about price—it’s about positioning.
Market signals:
Distribution pattern forming
Liquidity void below current level
Compression likely to result in expansion (downside bias)
In markets like these, timing is everything.
Capital flows speak louder than sentiment.
#SP500 #MarketStructure #InstitutionalTrading #TechnicalAnalysis #SmartMoney #LiquidityZones #MacroStrategy #WaverVanir #RiskManagement
Disclaimer
The information and publications are not meant to be, and do not constitute, financial, investment, trading, or other types of advice or recommendations supplied or endorsed by TradingView. Read more in the Terms of Use.
Disclaimer
The information and publications are not meant to be, and do not constitute, financial, investment, trading, or other types of advice or recommendations supplied or endorsed by TradingView. Read more in the Terms of Use.