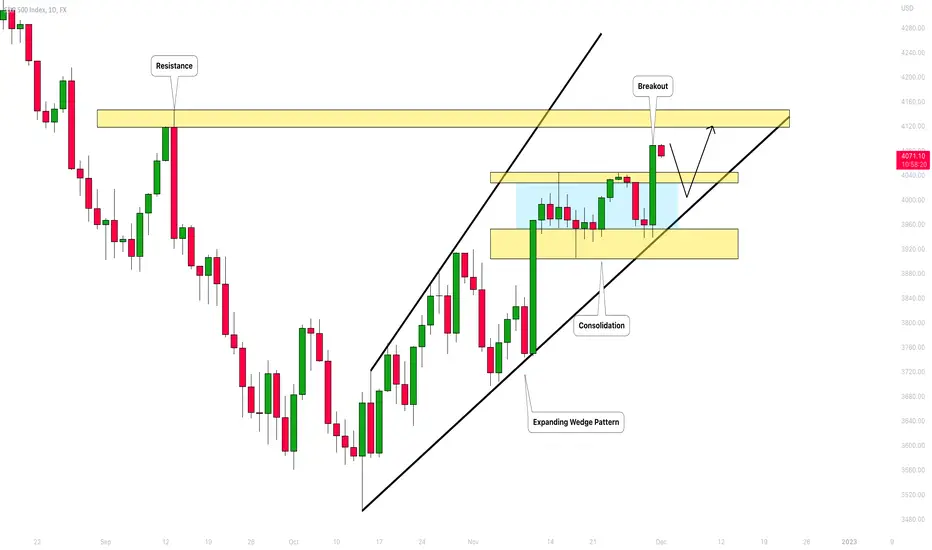
S&P500 index is trading within an expanding wedge pattern on a daily.
The price was stuck within a horizontal trading range for 2 week.
Its resistance was finally broken yesterday.
I think that it may push the market higher.
Next resistance - 4118.
❤️If you have any questions, please, ask me in the comment section.
Please, support my work with like, thank you!❤️
✅Join My Telegram Channel: t.me/VasilyTrading
❗️YouTube Channel youtube.com/c/VasilyTrader
✅ Facebook: facebook.com/VasilyTrading/
⭐ My Forex & Gold Broker: bit.ly/vasilyforexbroker ⭐
❗️YouTube Channel youtube.com/c/VasilyTrader
✅ Facebook: facebook.com/VasilyTrading/
⭐ My Forex & Gold Broker: bit.ly/vasilyforexbroker ⭐
Related publications
Disclaimer
The information and publications are not meant to be, and do not constitute, financial, investment, trading, or other types of advice or recommendations supplied or endorsed by TradingView. Read more in the Terms of Use.