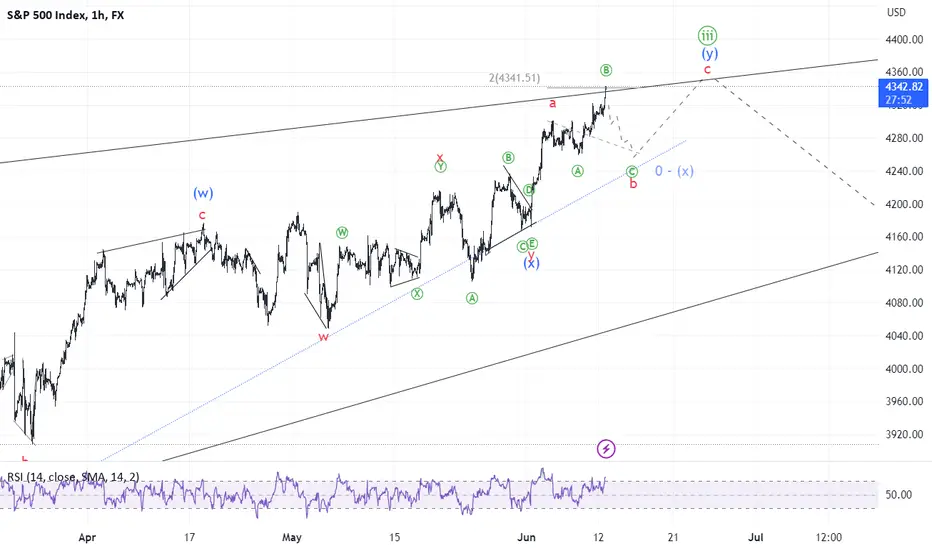
I will not pretend I understand what is hapenning in SP500 at the moment. I assume this is [B] as per previous post because the count on a lower timeframes is almost impossible to guess. That is often a good sign of B or X waves.
Disclaimer
The information and publications are not meant to be, and do not constitute, financial, investment, trading, or other types of advice or recommendations supplied or endorsed by TradingView. Read more in the Terms of Use.
Disclaimer
The information and publications are not meant to be, and do not constitute, financial, investment, trading, or other types of advice or recommendations supplied or endorsed by TradingView. Read more in the Terms of Use.